User manual
Note
This user manual assumes Quality-time has been installed, is up and running, and that you have opened Quality-time in your browser. See the Deployment instructions on how to deploy Quality-time.
Logging in and out
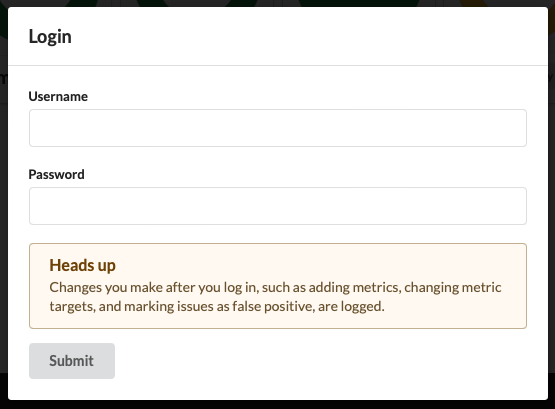
You can view Quality reports without logging in, but to edit reports and metrics you need to log in. Click the “Login” button in the menu bar:


Enter your LDAP-credentials in the dialog:
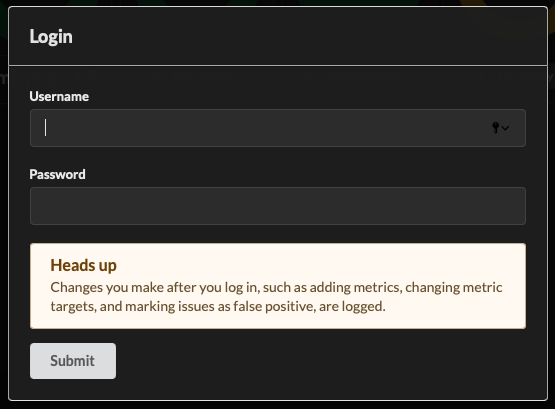
Note
You can either use your canonical LDAP name as username or your LDAP user id. Please contact your system administrator if you don’t know your LDAP credentials.
After hitting “Submit” you should be logged in. The menu bar shows your username. If you have a Gravatar, it will be displayed next to your username.


Clicking your username and then “Logout” logs you out from Quality-time. If you don’t log out manually, your user session will expire after 24 hours and you need to log in again to be able to edit reports.
Configuring permissions
Quality-time implements a limited permissions system. Anybody (authenticated and not authenticated) can always view all the information in Quality-time. By default, anybody who is logged in can edit reports, subjects, metrics, sources and measured entities. However, this access can be restricted to certain users. On the homepage, expand the reports overview title to see two input fields to grant users report editing rights or entity editing rights.
Report edit permission
Report edit permission allows a user to edit the reports in this Quality-time instance. That means to edit the add, edit, and delete reports, subjects, metrics, and sources.
If you forget to add yourself, your username will be added automatically. This means that you can’t retract your own report editing rights: add another user and ask them to remove your username or email address.
To restore the default situation where every logged-in user can edit reports, subjects, metrics, and sources, remove all usernames and email addresses.
Entity edit permission
Entity edit permission will allow a user to update the status of measured entities. A user with this permission can for example mark violations as false positives.
Unlike for the report edit permission, it’s possible to retract yourself from the list of entity editors.
To restore the default situation where every logged-in user can edit entities, remove all usernames and email addresses.
Configuring quality reports
Each Quality-time instance can serve multiple quality reports. A quality report consists of one or more subjects - things such as software products, projects, and processes - that you want to measure the quality of. Each subject has one or more metrics that tell you something about the quality of the subject. For example, the number of failing test cases of an application, or the number of ready user story points for a Scrum team. To collect the measurement data, each metric has one or more sources that Quality-time will use to measure the metric.
Attention
You need to be logged in to be able to edit quality reports.
Configuring reports
Adding reports
To add a new report, be sure to be logged in and click the “Add report” button on the home page. This will create a new empty report. Click the report card in the dashboard to navigate to it.
Editing reports
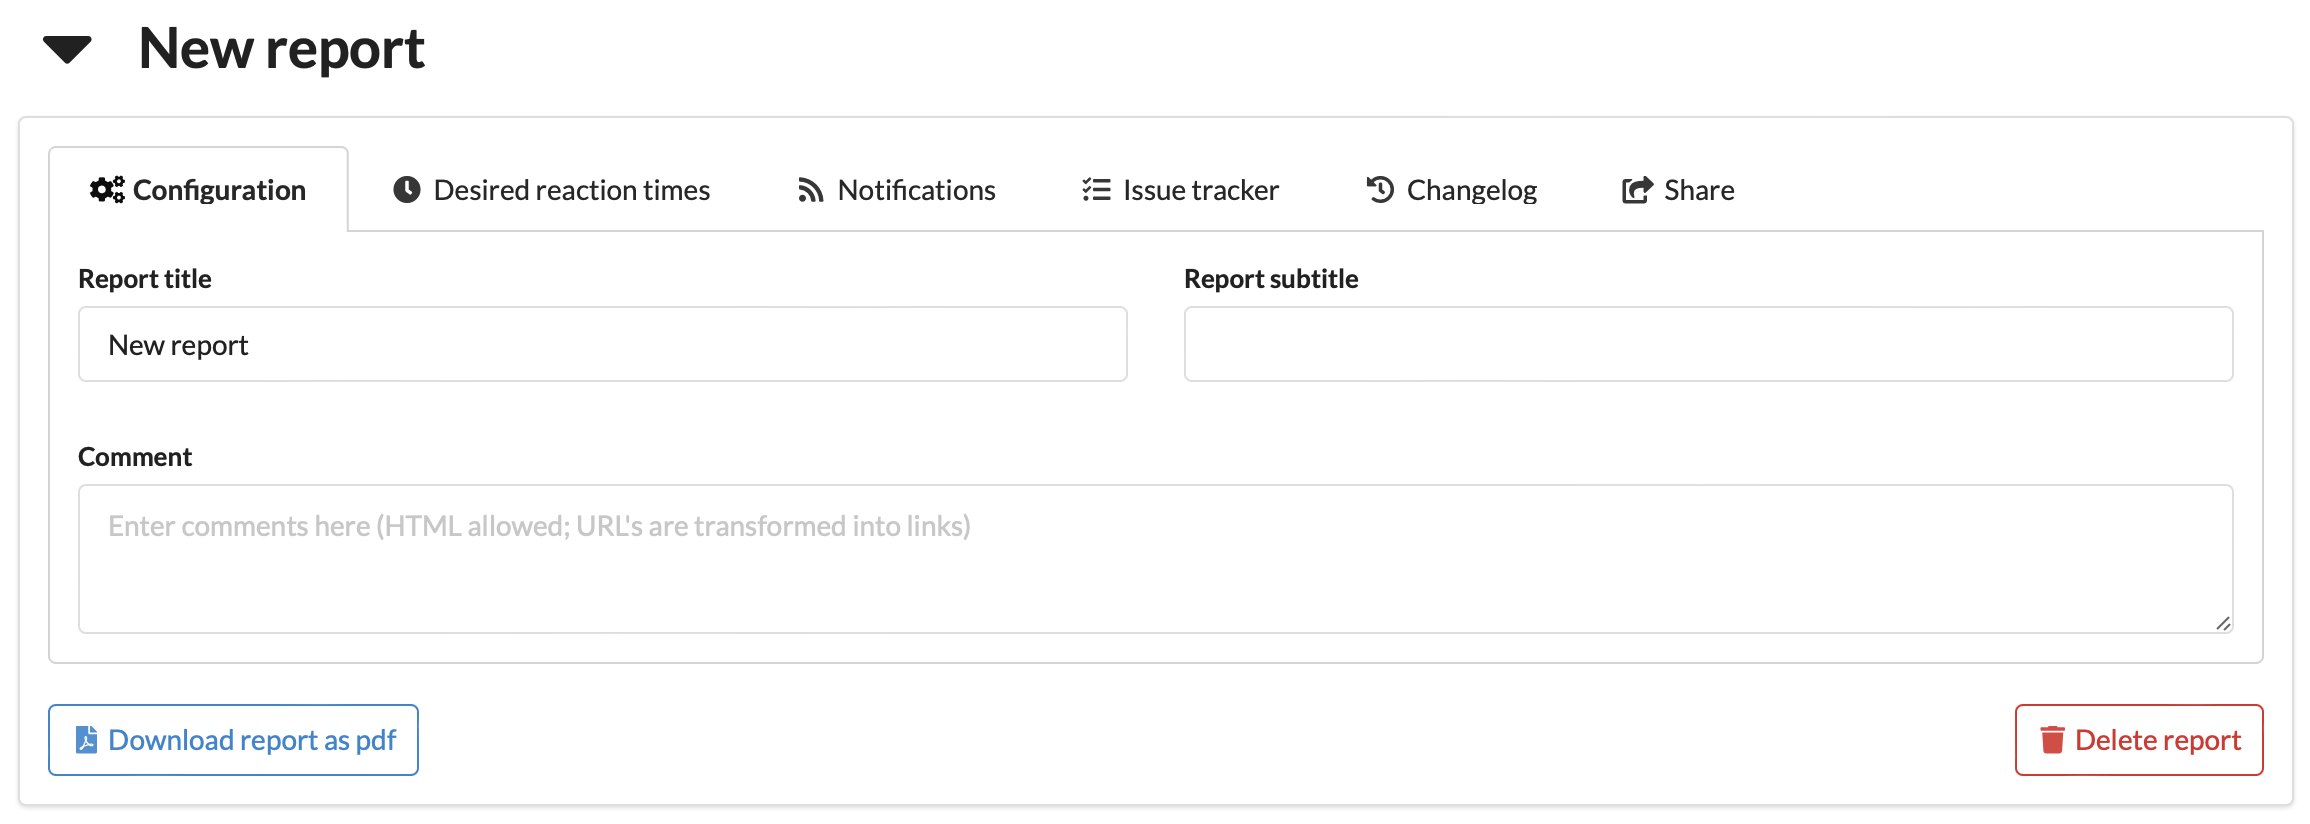
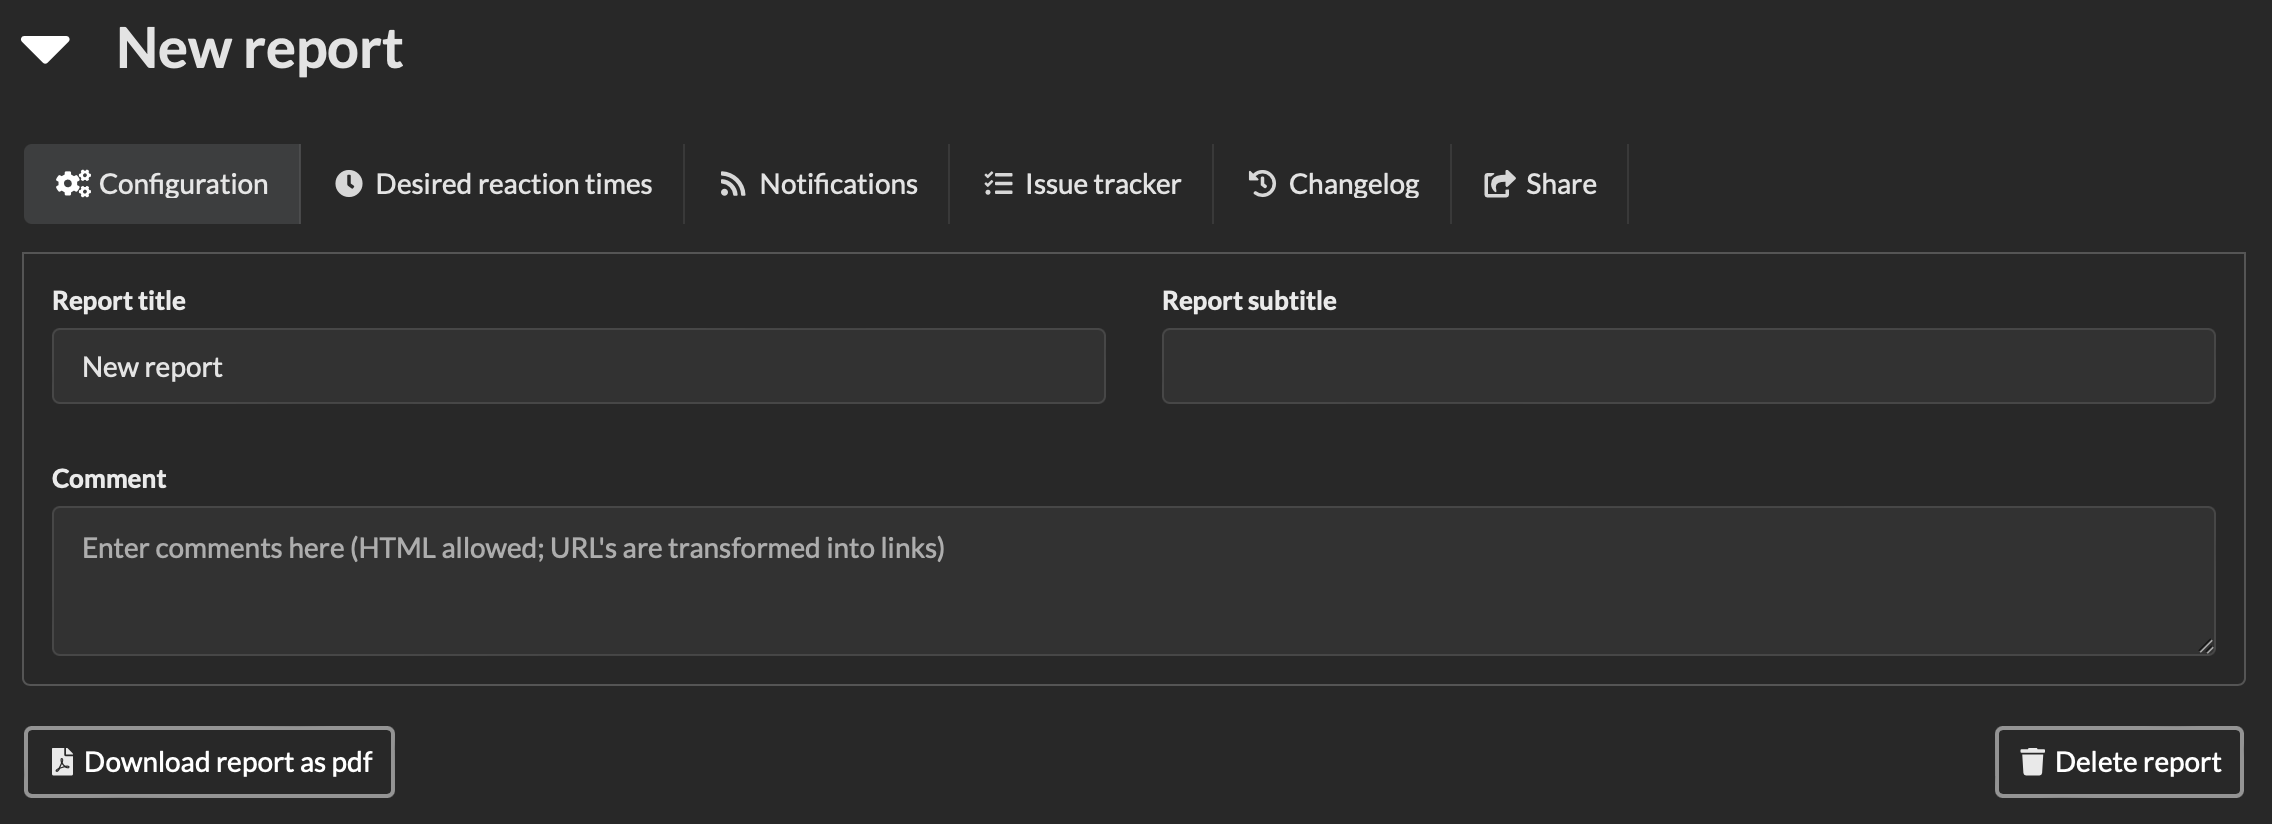
To change the title or subtitle of a report, expand the report header and enter a new title and/or subtitle in their respective fields. For the desired reaction times, see the Customizing quality reports section below. For the issue tracker, see the Issue tracker section below. For notifications, see the Notifications section below.
The “Comment” field can be used to describe the report, or any other information. HTML and URLs are supported. The entered comments are shown between the report title and the dashboard.
Deleting reports
To delete a report expand the report header and click the “Delete report” button. The report and all its subjects is deleted.
Danger
Be careful, there’s no way to undo your action via the user interface.
Configuring subjects
Adding subjects
Each quality report consists of “subjects”. Subjects are the things being measured by Quality-time. A subject can for example be a software product or component, a software process, or a continuous integration pipeline.
See also
See the reference manual for the list of supported subject types.
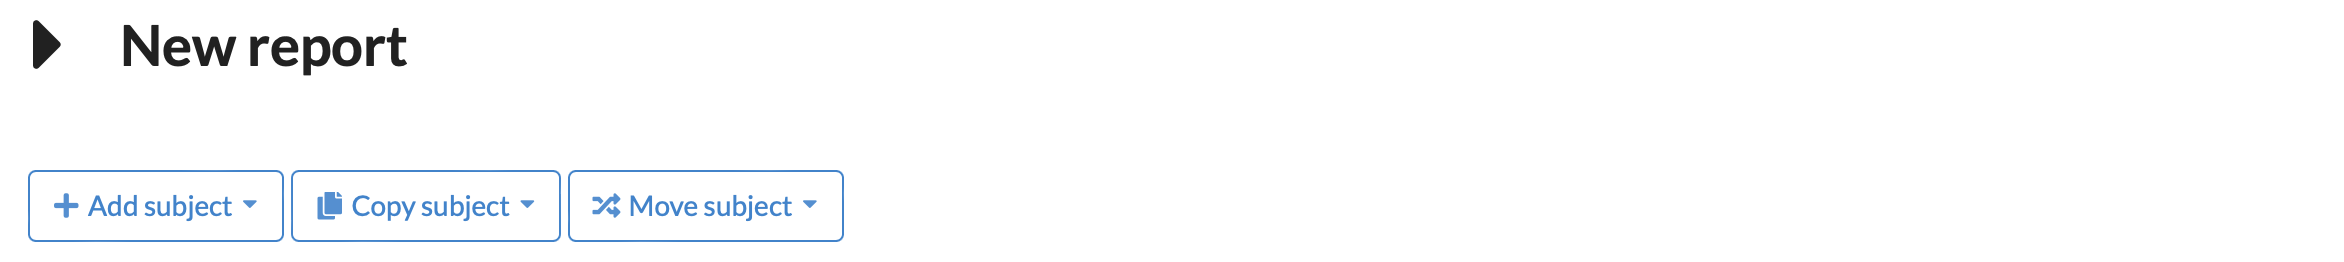
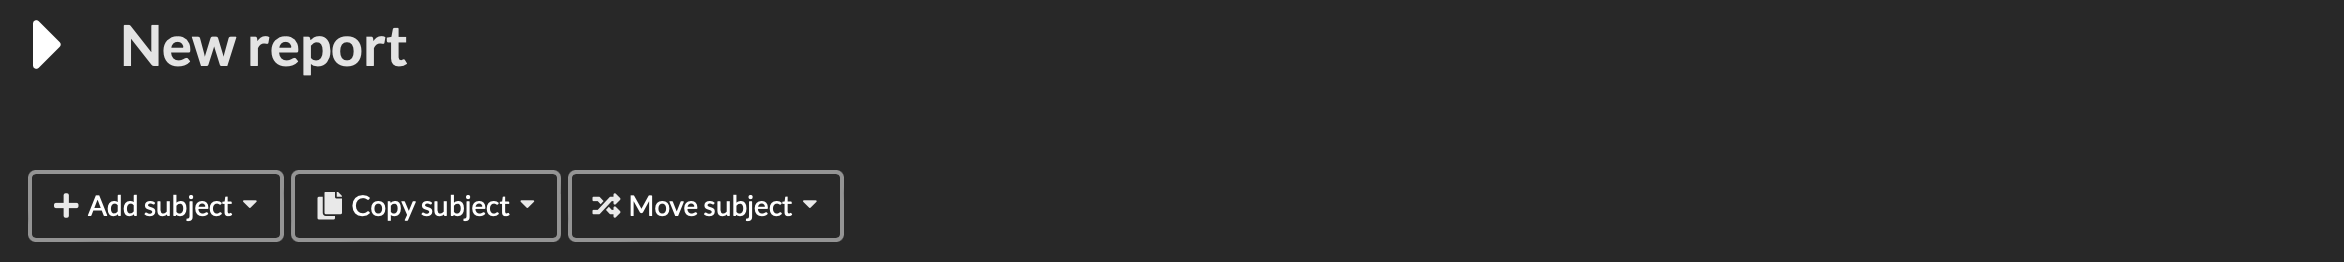
To add a new subject, be sure you are logged in and are on a report page. Click the “Add subject” button to select a subject type and add a new subject. The subject is added to the report dashboard.
Alternatively, you can also copy an existing subject or move an existing subject to the report. Clicking the “Copy subject” or “Move subject” button shows a drop down menu with all of the subjects to choose from. Copying or moving a subject also copies or moves the metrics and sources of the subject.
Note
When copying a subject, the metrics and sources are copied but measurement history and changelog are not included. When moving a subject, the metrics, sources, measurement history, and changelog are all preserved.
Editing subjects
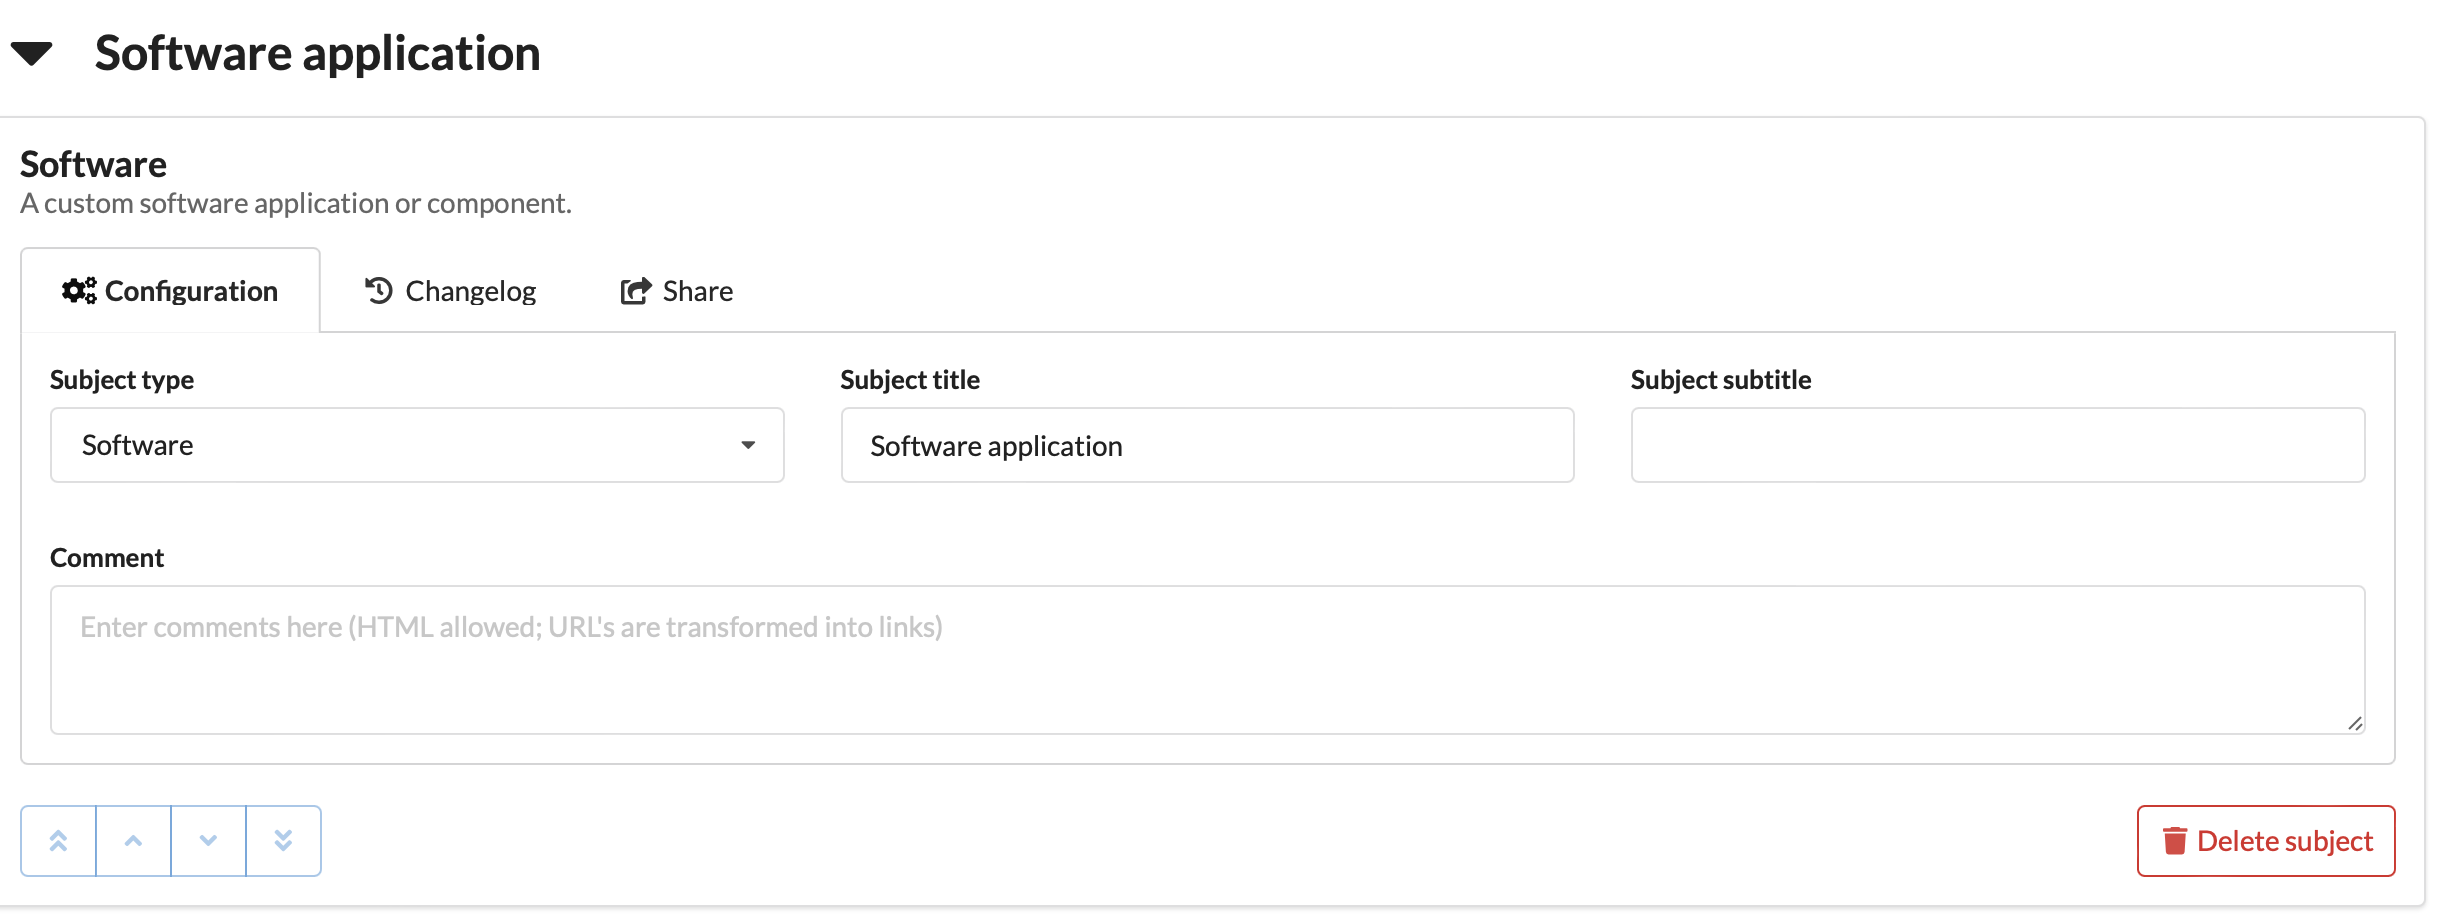
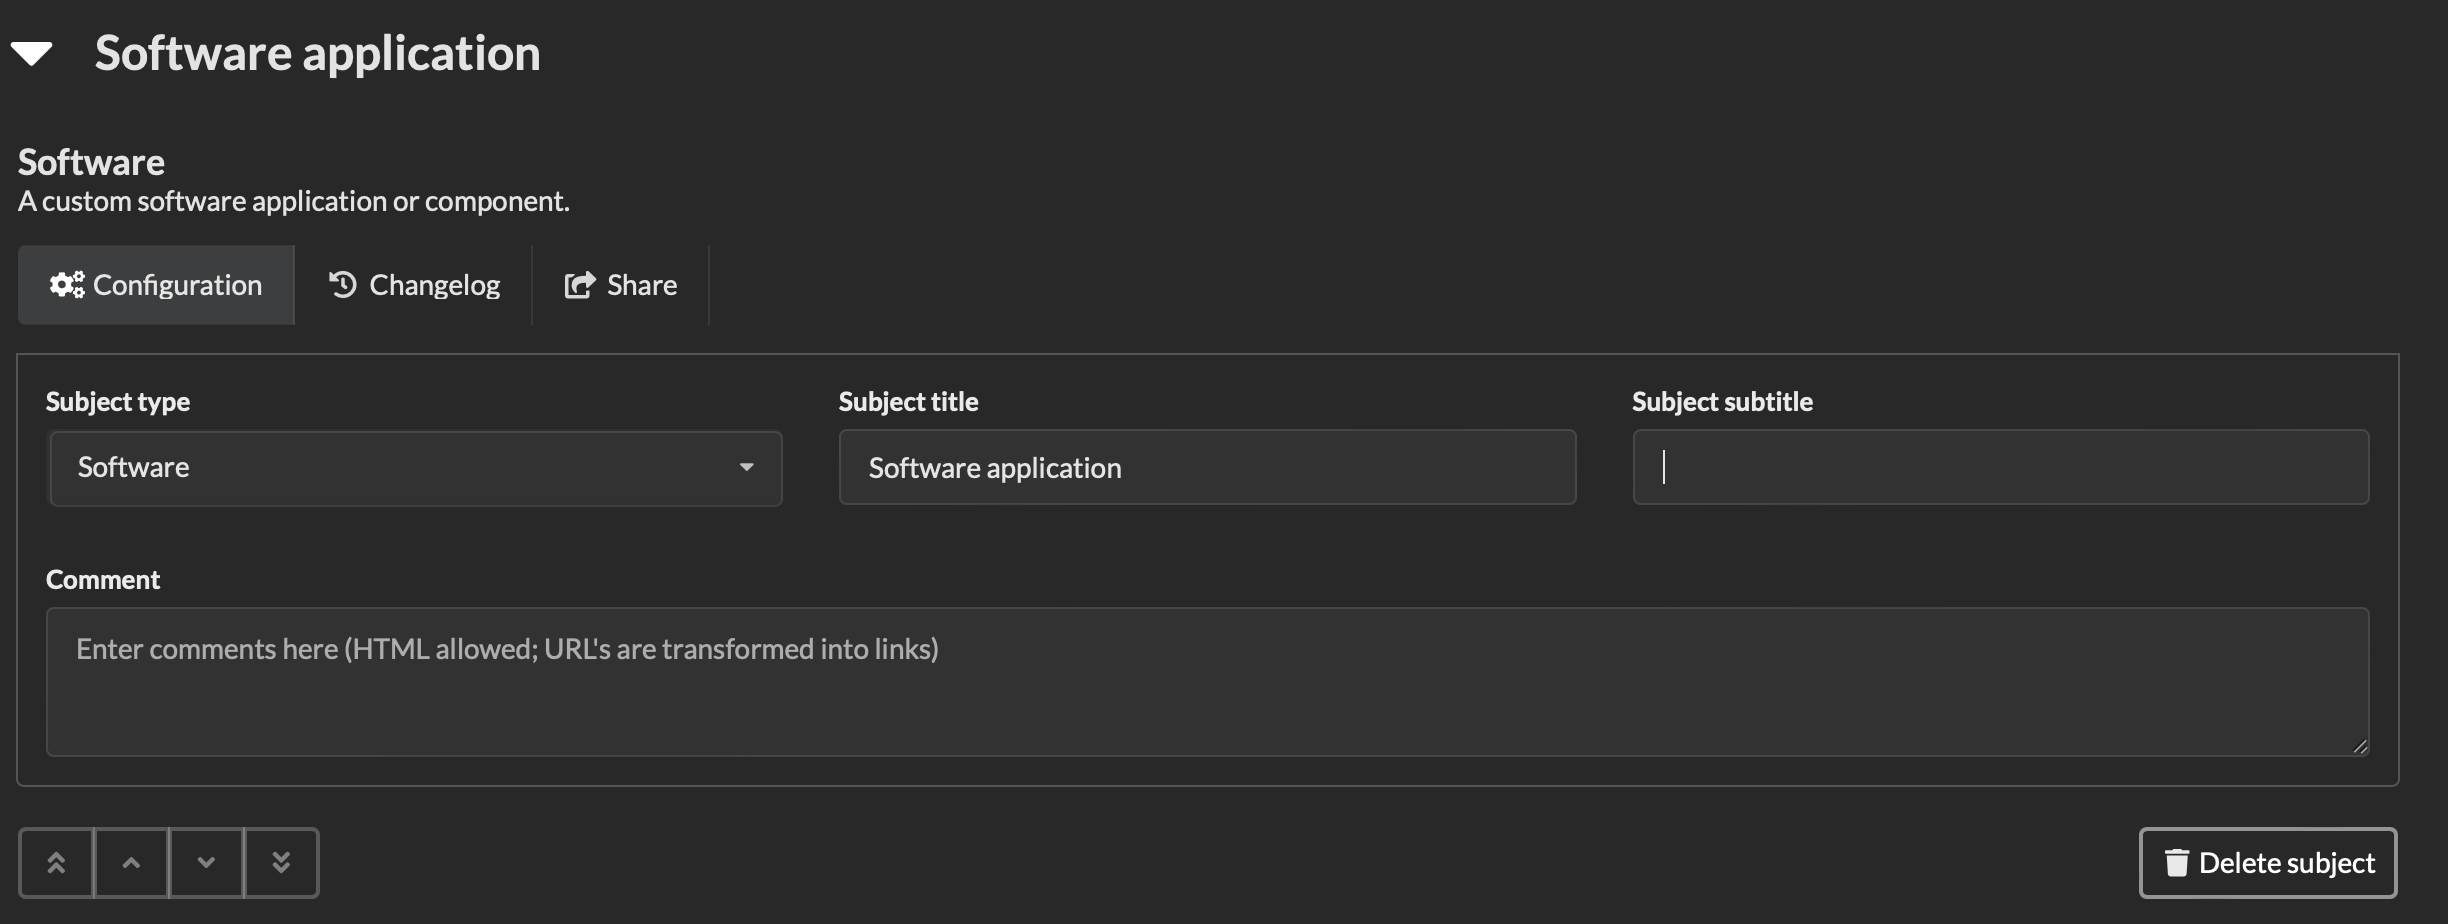
To change the subject type and name expand the subject header if it’s not already expanded. The subject type can be changed by means of the “Subject type” dropdown.
Note
Changing the subject type influences which types of metrics Quality-time offers you to add to a subject. However, it is always possible to ignore the suggested metric types and add other types.
To change the title or subtitle of the subject, enter a new title and/or subtitle in their respective fields.
The “Comment” field can be used to describe the subject, or any other information. HTML and URLs are supported. The entered comments are shown between the subject title and the table with metrics.
Deleting subjects
To delete a subject expand the subject header and click the “Delete subject” button. The subject and all its metrics is deleted.
Danger
Be careful, there’s no way to undo your action via the user interface.
Reordering subjects
To reorder subjects, expand the subject title and use the buttons on the lower left-hand side to move the subject up or down, or to the first or last position in the report. The order is saved on the server.
Configuring metrics
Adding metrics
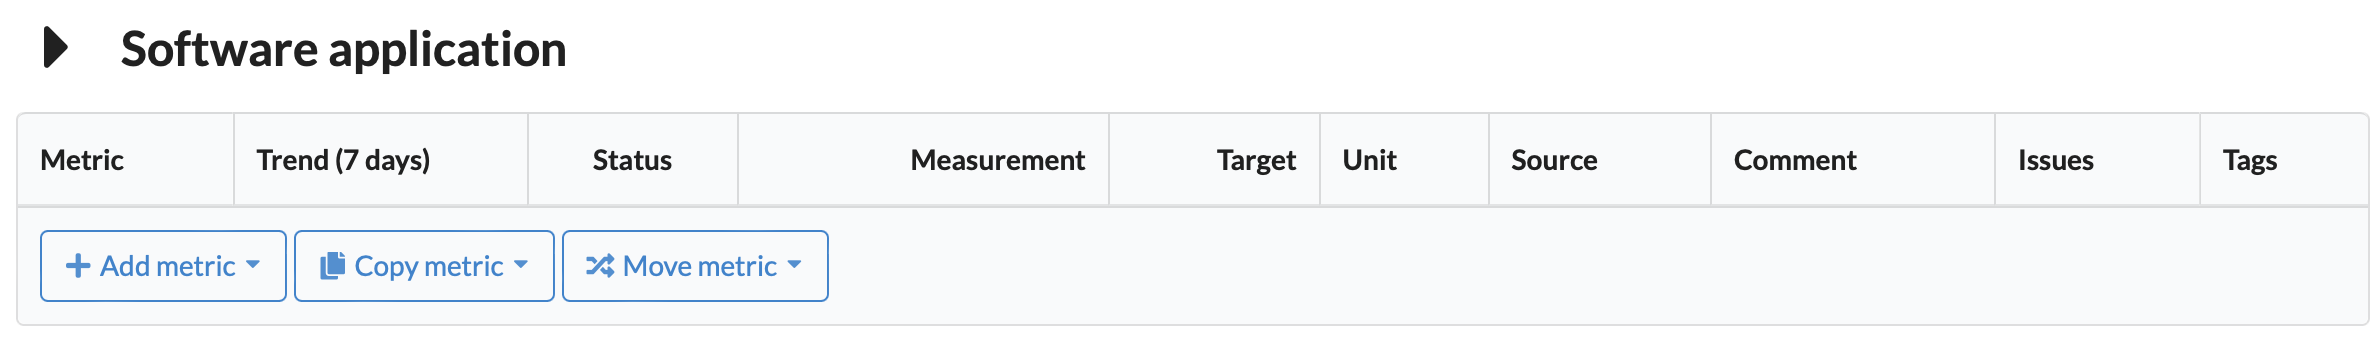
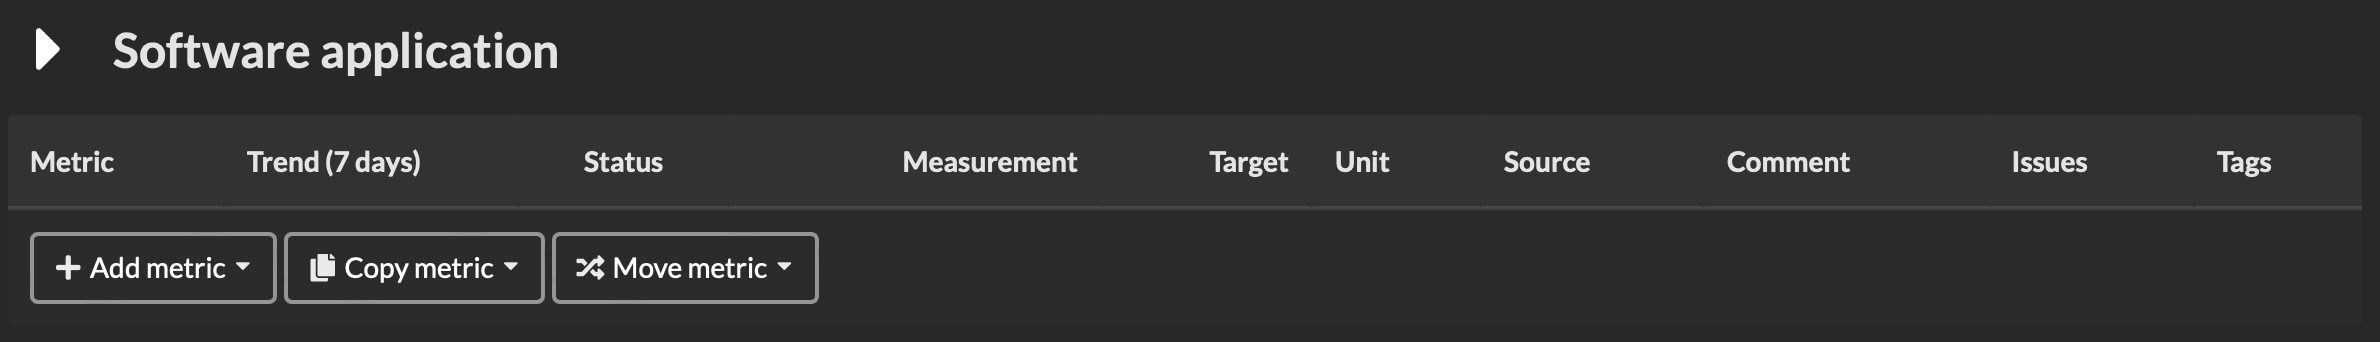
To add a metric to a subject, hit the “Add metric” button to select a metric type and create a new metric. Only metric types that can measure the subject are listed.
See also
See the reference manual for the list of supported metric types.
Quality-time adds the selected metric to the report that you can next configure. It is immediately displayed in the metric table (and in the report dashboard) as white and with a question mark because Quality-time has no data on this metric yet.
Alternatively, you can also copy an existing metric or move an existing metric to the subject. Clicking the “Copy metric” or “Move metric” button shows a drop down menu with all of the metrics to choose from. Copying or moving a metric also copies or moves the sources of the metric.
Note
When copying a metric, the sources are copied but measurement history and changelog are not included. When moving a metric, the sources, measurement history, and changelog are all preserved.
Editing metrics
After you’ve added a metric, the metric is visible in the subject’s metric table. You can change the metric configuration in the metric tab.
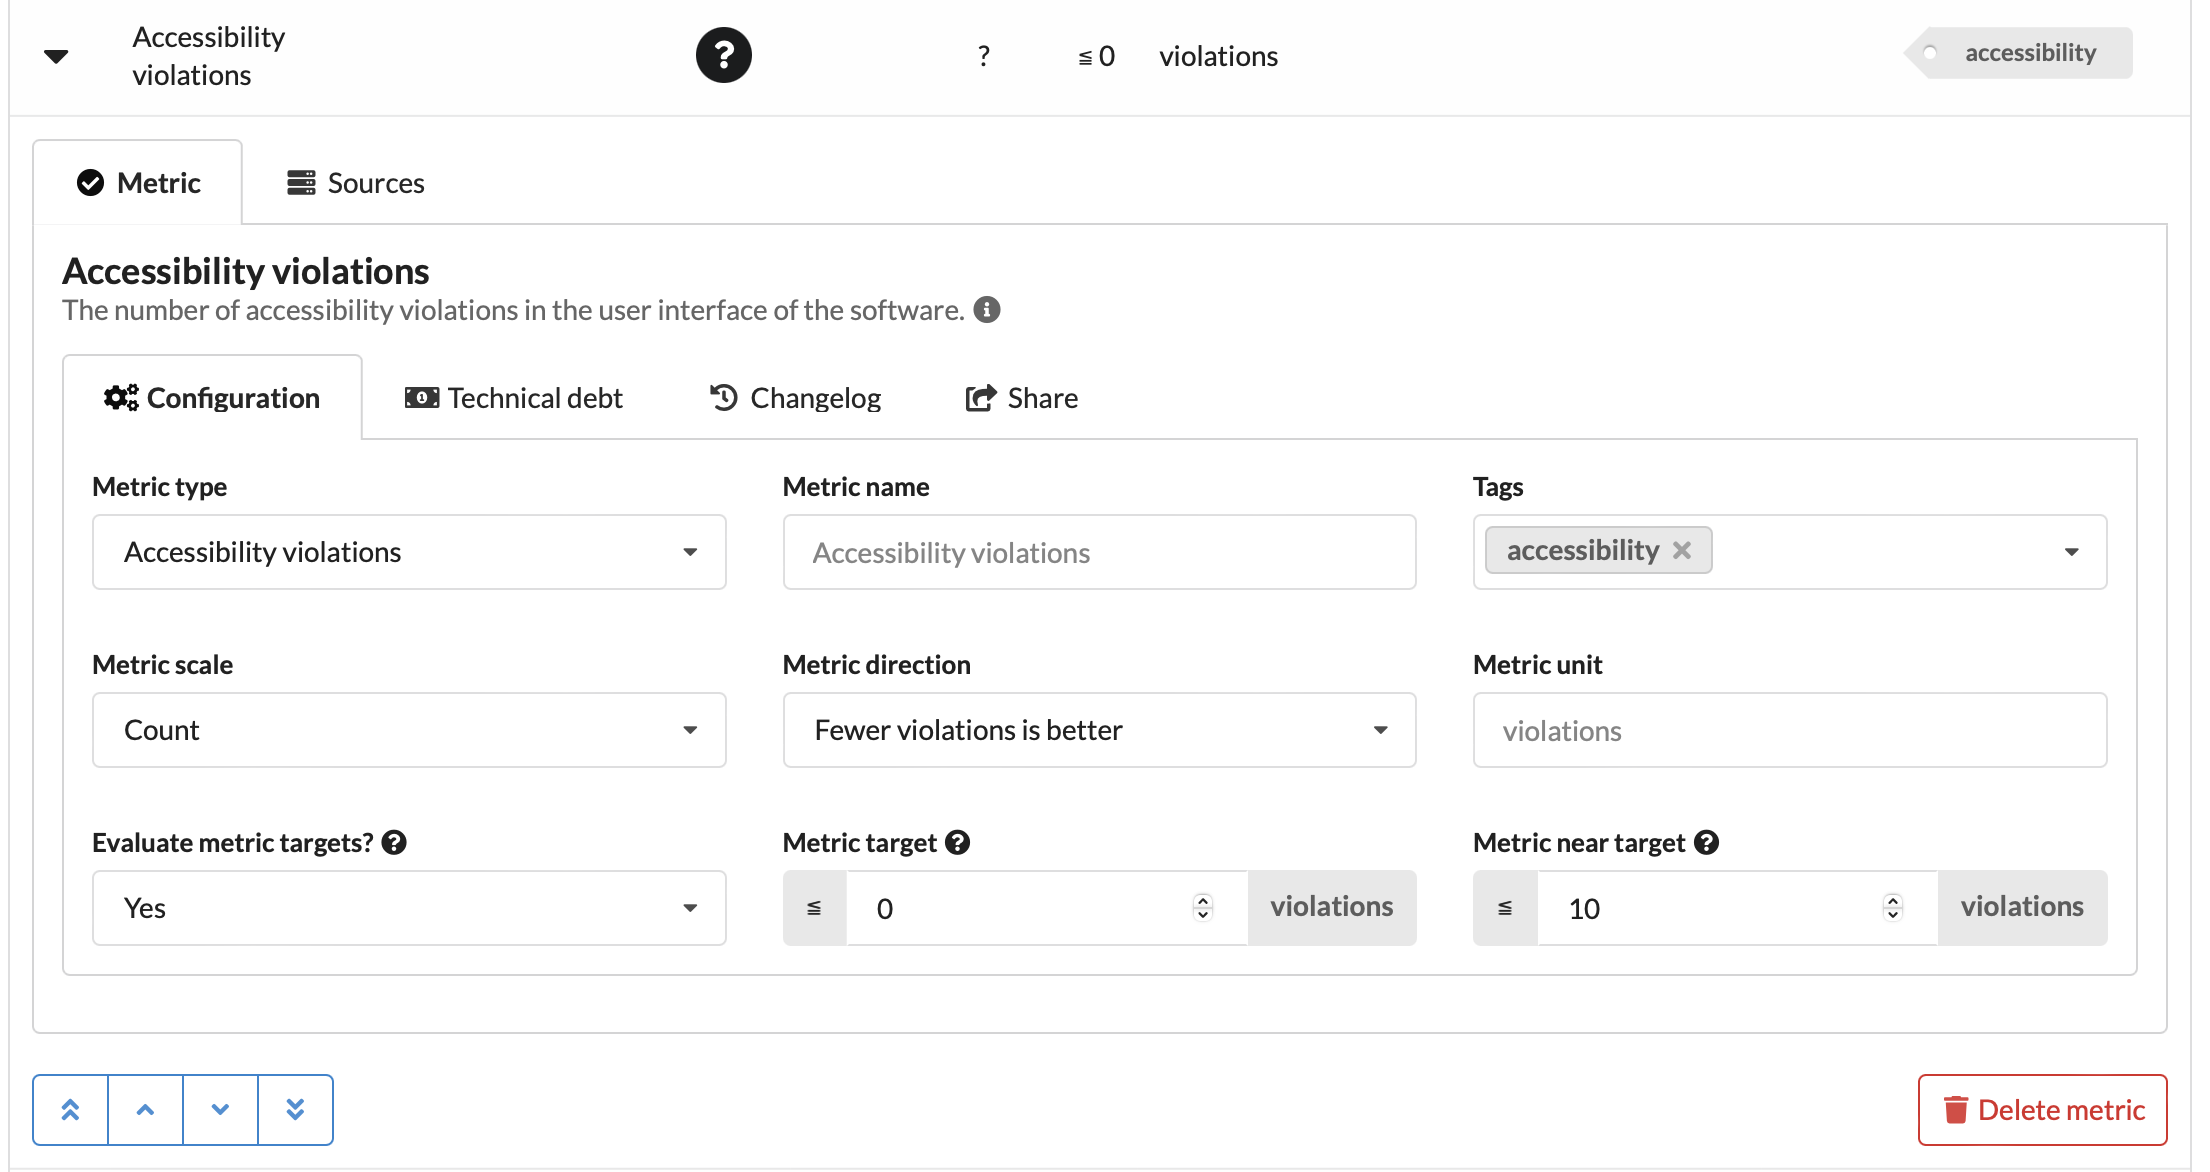
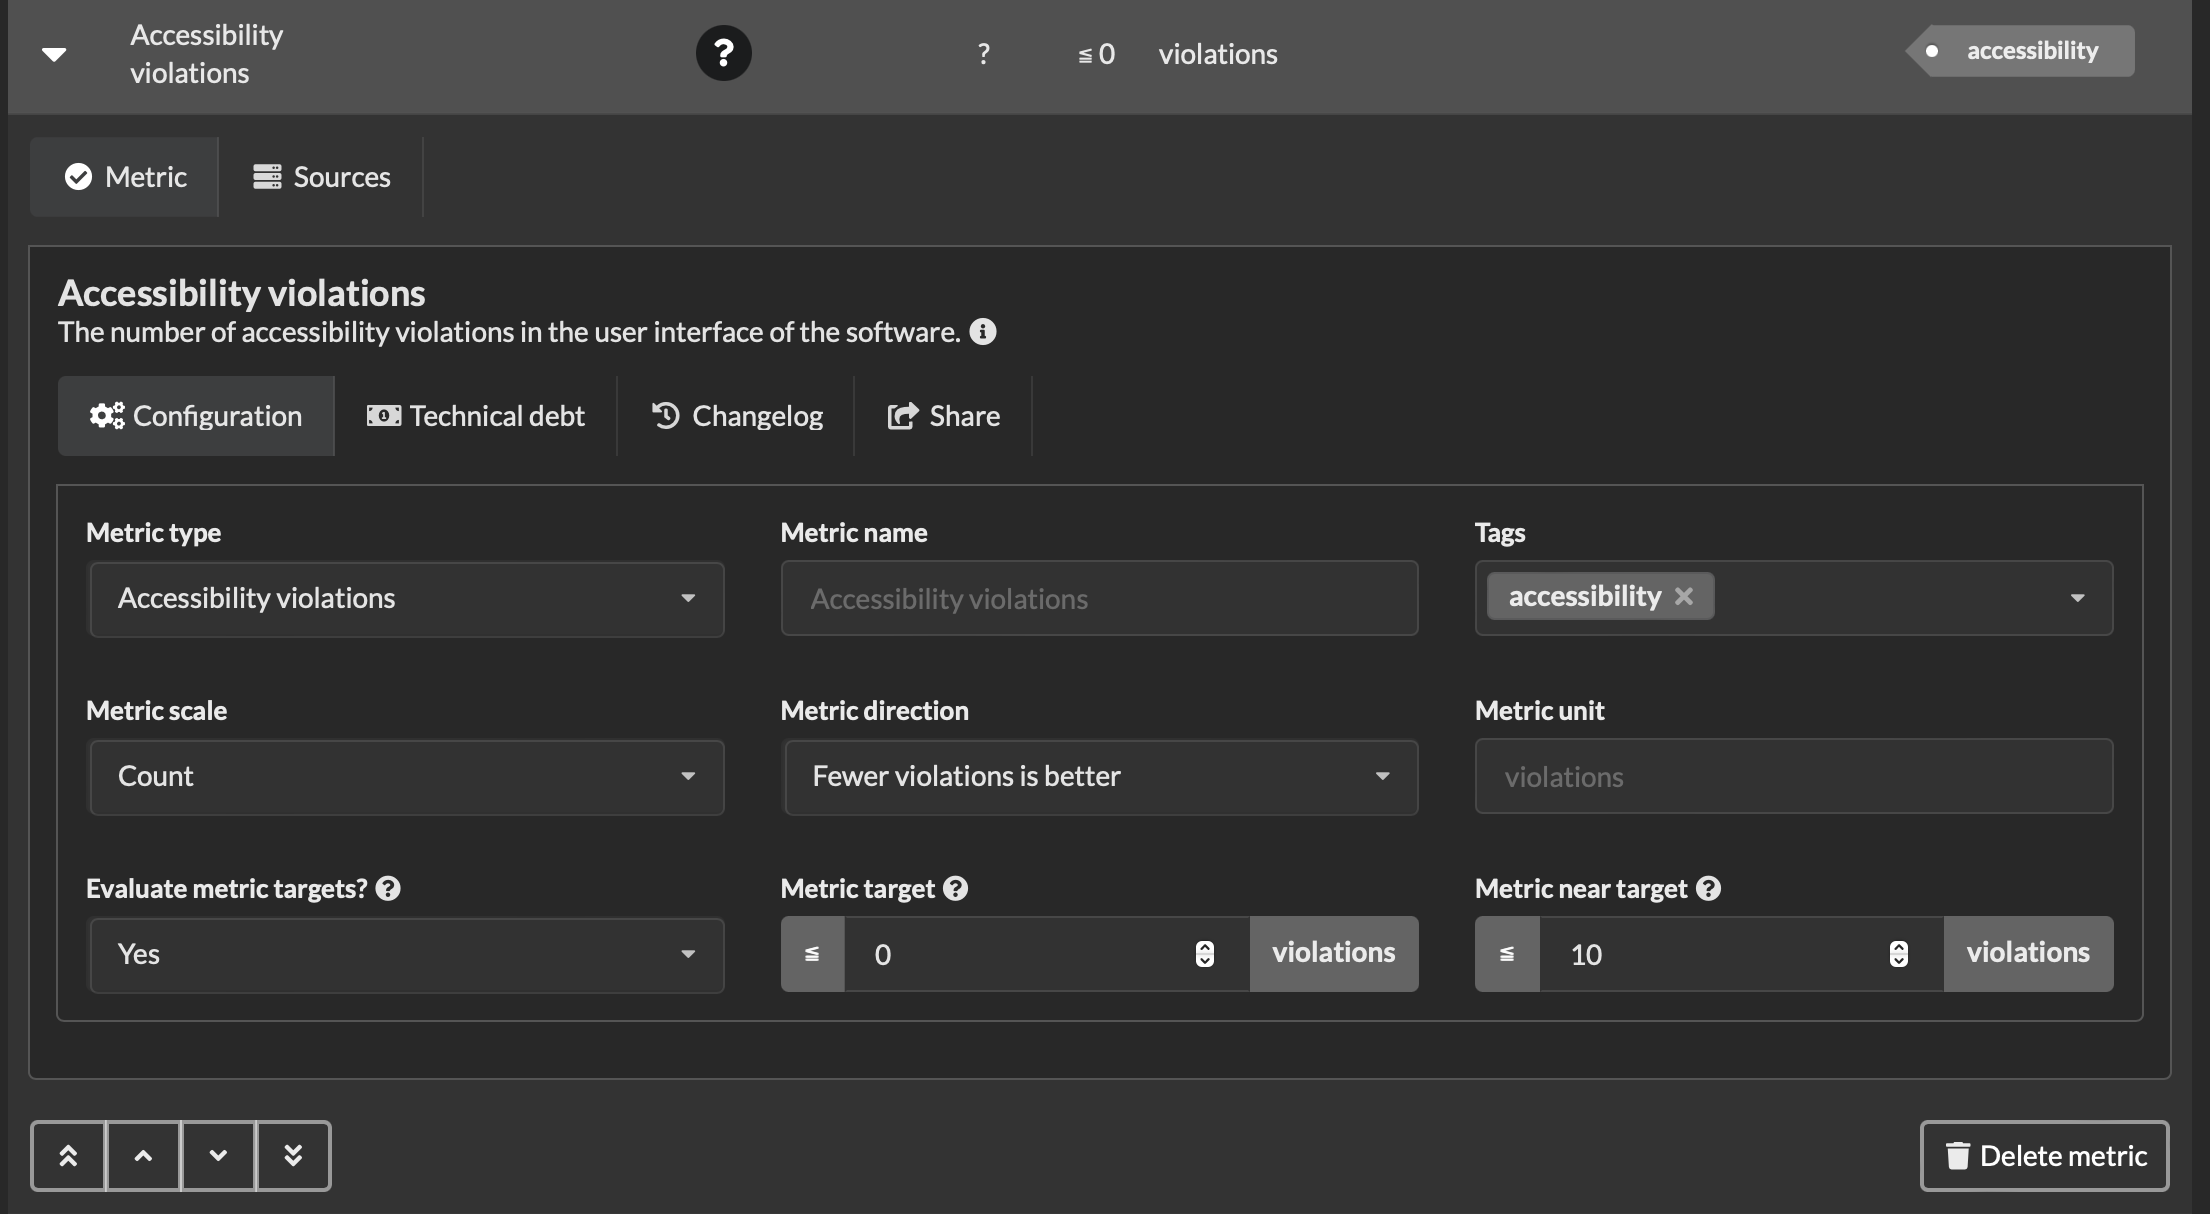
The first parameter is the “Metric type”. The metric type determines what gets measured. By default, the name of the metric is equal to its type, “Violations” in the example above, but you can change the metric name using the “Metric name” field. When you change the metric type, the sources you can select in the “Sources” tab change accordingly.
Warning
If you change the type of a metric that has sources configured, sources that do not support the new metric type will not be removed, but of course they can’t provide the data needed by the metric and you’ll see an error message.
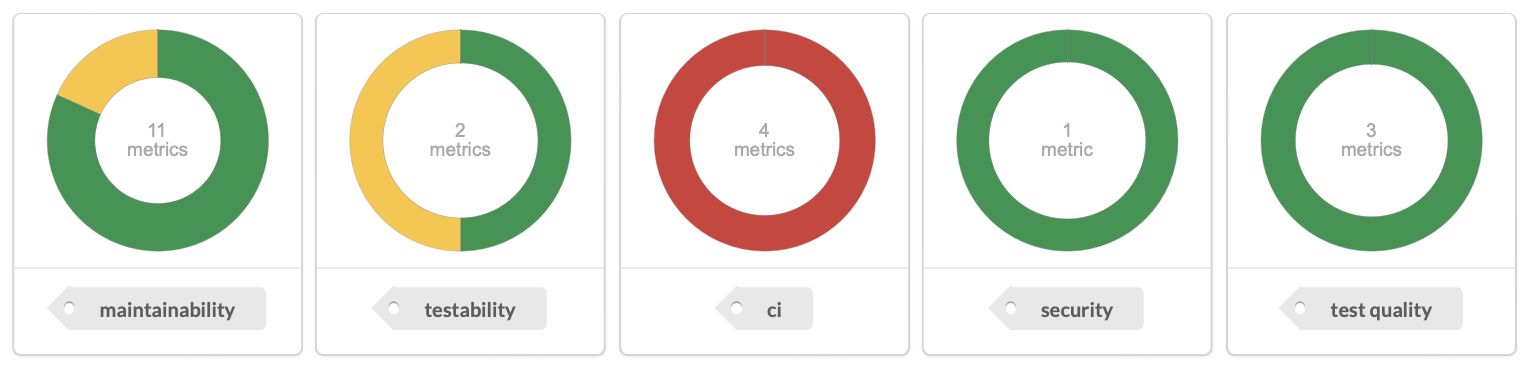
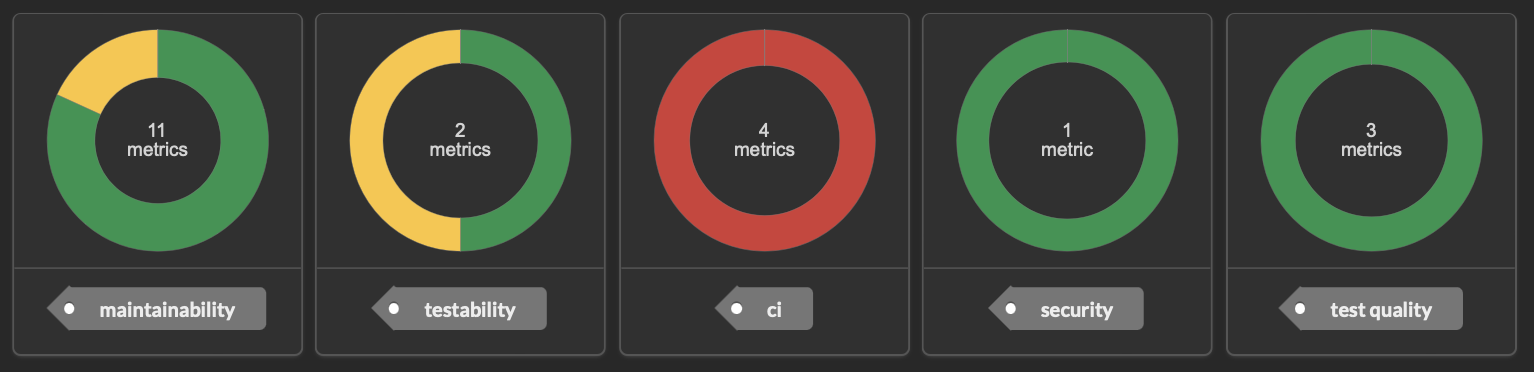
Metrics can have zero or more arbitrary “Tags”. Most metric have a default tag, but you can remove it and/or add more if you like. For each tag, the report dashboard at the top of the page shows a summary of the metrics with that tag:
Bulk rename and removal of tags is possible via the report title. Expand the report title and navigate to the ‘Tags’ tab.
The “Metric scale” field determines what scale to use to measure the metric. Most metrics support either the “Count” scale, the “Percentage” scale, or both. For example, with the duplicated lines metric, setting the metric scale to “Percentage” means that the percentage of lines that are duplicated is shown instead of the count of duplicated lines.
The “Metric direction” determines whether lower measurement values are considered to be better or worse. Usually, the default direction is correct. An example of a metric where you might want to change the direction is the “tests” metric. When used to measure the number of tests, more tests is better. But, when used to measure the number of failing tests, fewer is better.
The “Metric unit” derives its default value from the metric type. Override as needed.
The “Metric target” determines at what value a measurement is below or above target. In the example below only measurement values of 0 are on target. The “Metric near target” determines when the measurement value is sufficiently close to the target to no longer require immediate action. Metrics near their target are yellow.
If you don’t want to evaluate the metric against targets, but only want to track its measurement value, you can set the “Evaluate metric targets?” field to “No”. The metric status will always be “Informative”, unless the source data is missing. Vice versa, if a metric is “Informative” by default you can set the “Evaluate metric targets?” field to “Yes” to have the metric be evaluated against targets.
Managing technical debt
If a metric doesn’t meet the target value, but your team isn’t able to fix the situation in the short run, you can accept the deviation as technical debt.
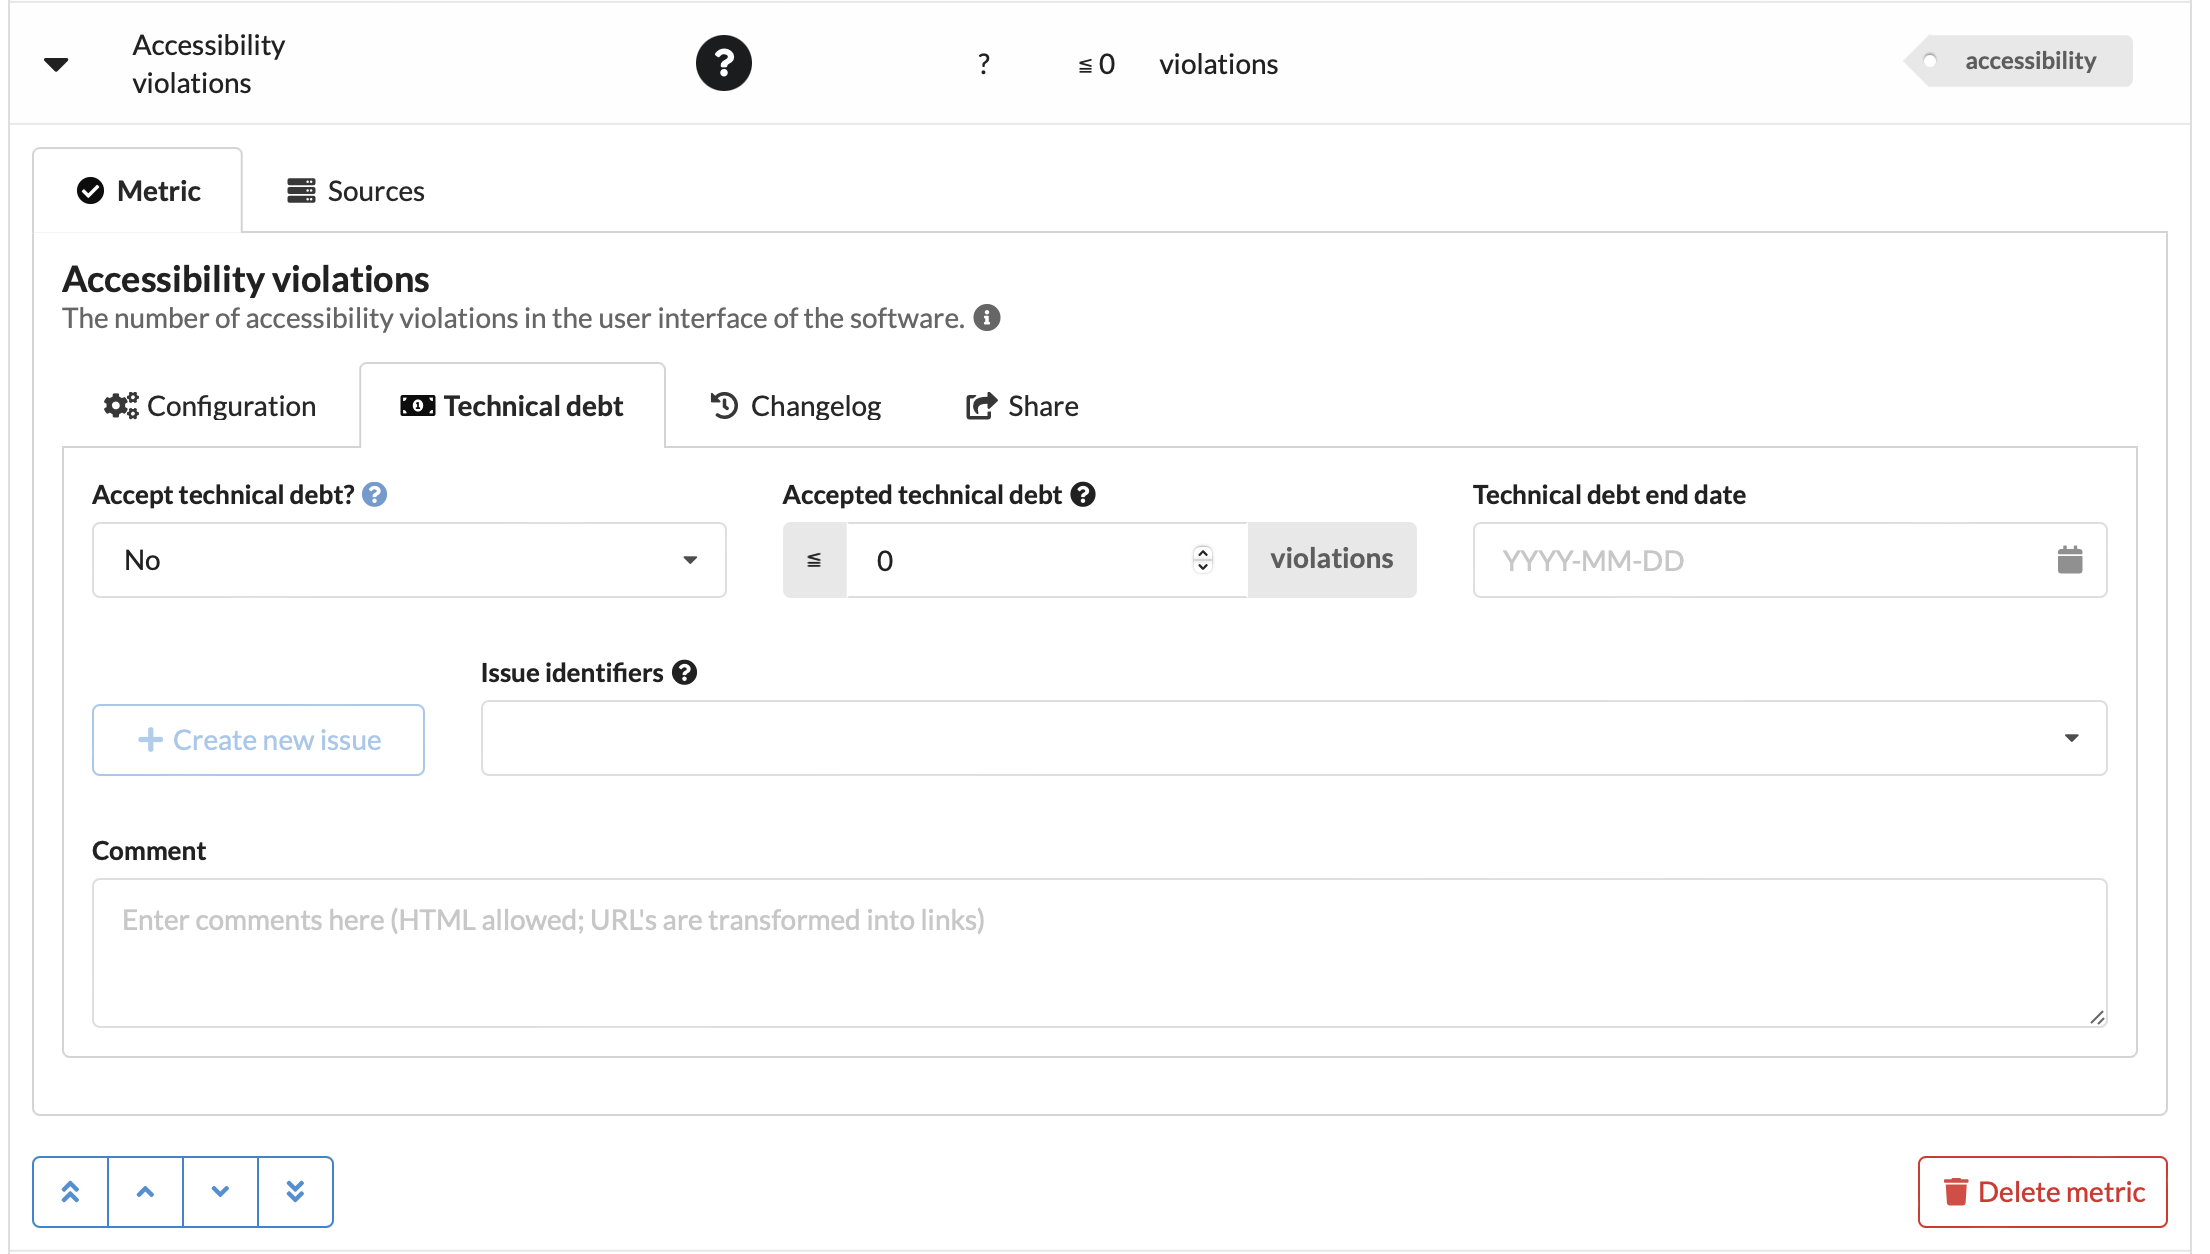
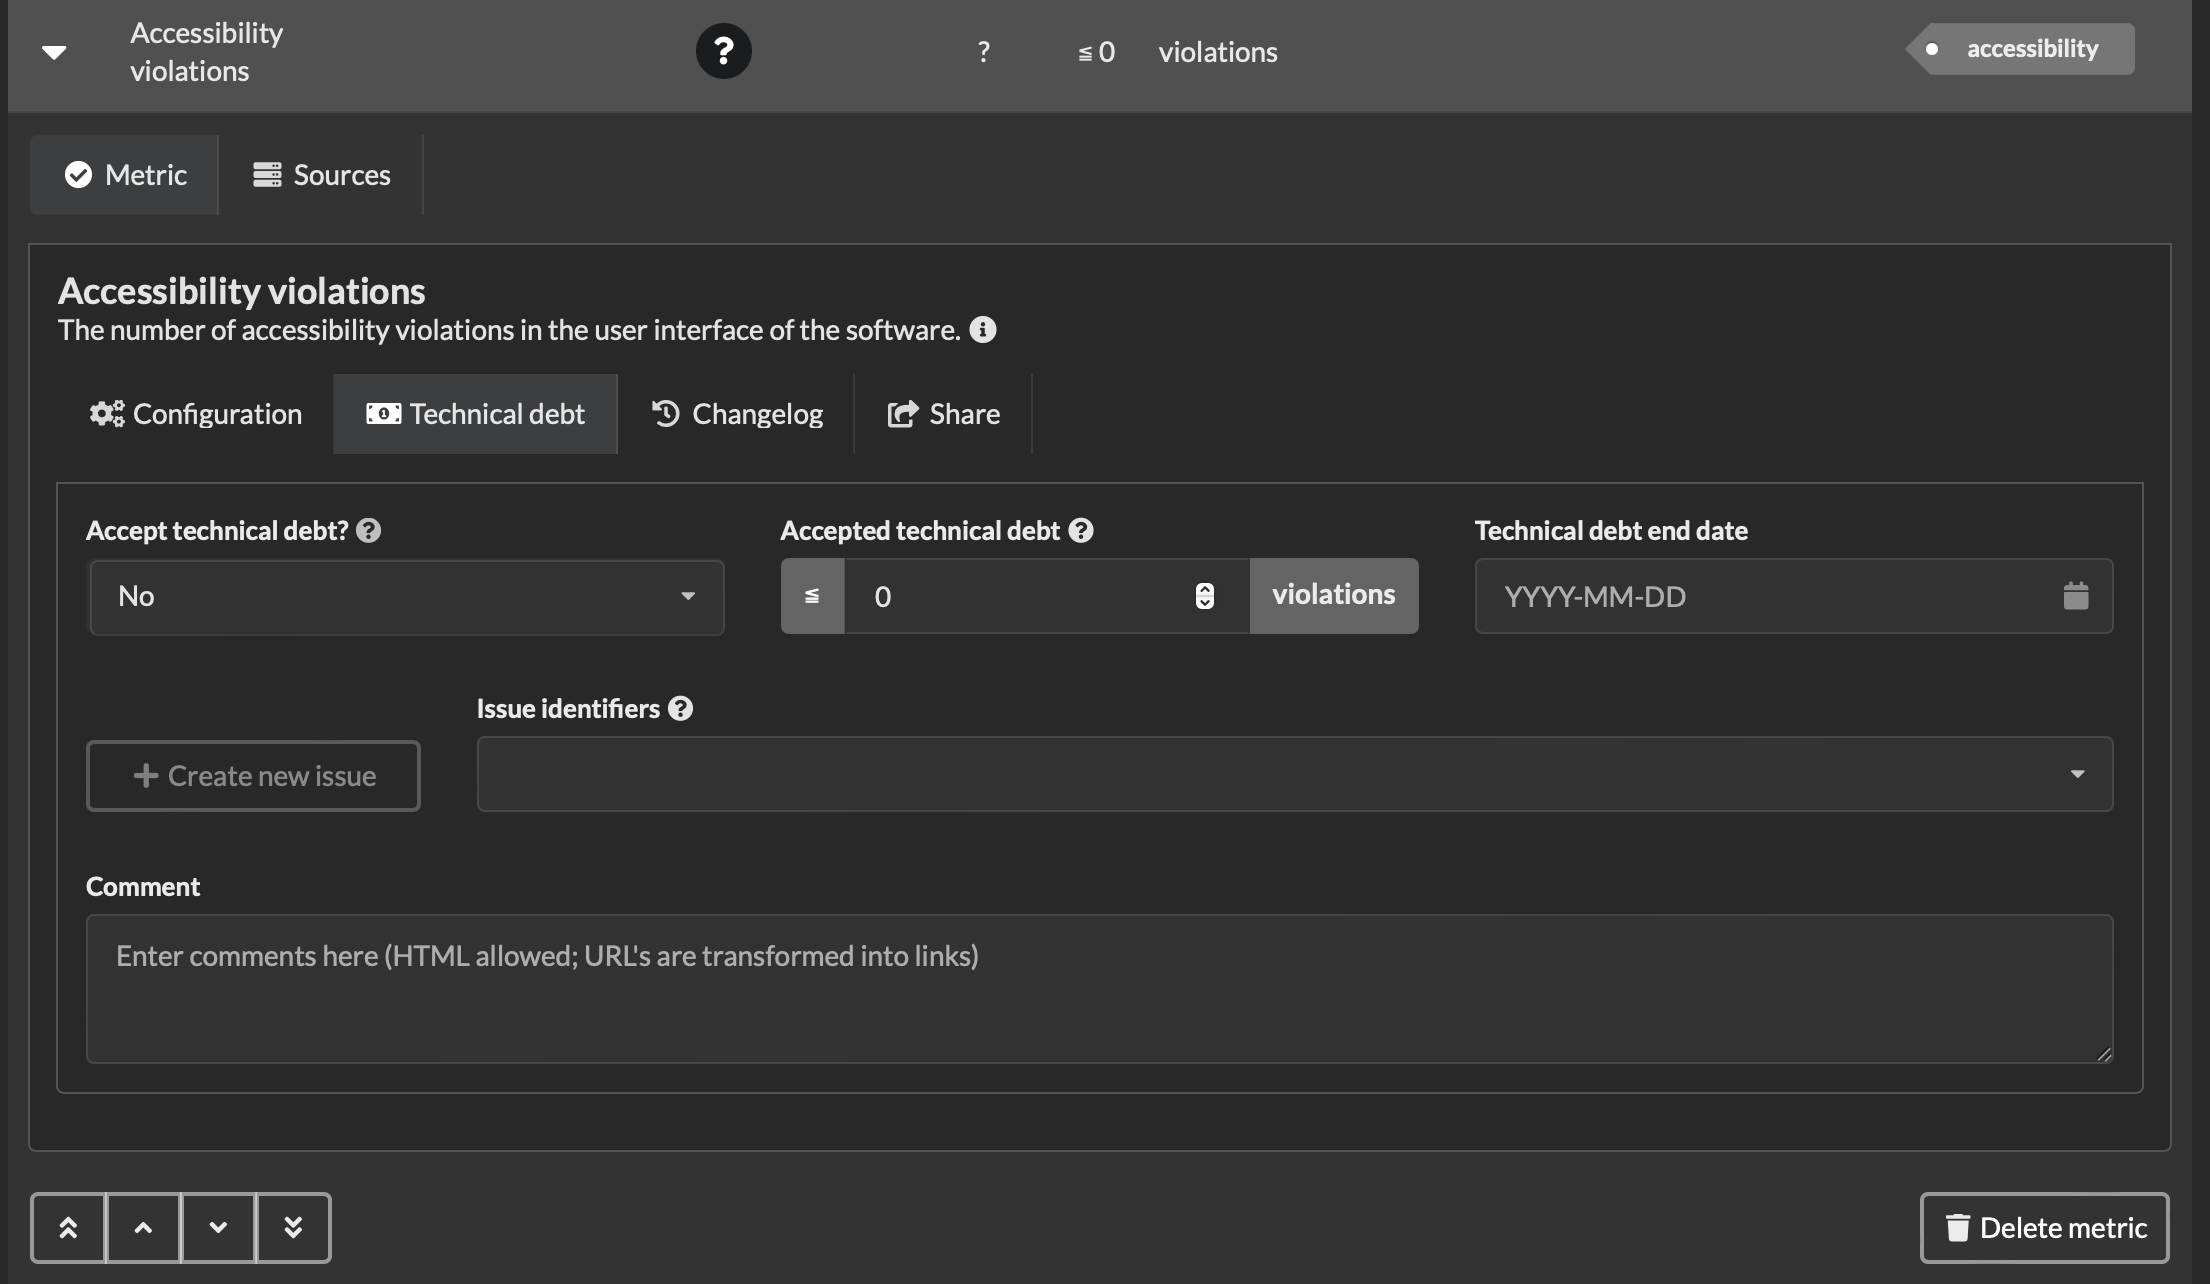
To accept technical debt, navigate to the “Technical debt” tab of the metric and set the “Accept technical debt?” field to “Yes”. Enter the value you’re accepting for the time being in the “Metric debt target” field. If you want to pay off the debt before a certain date, this can be registered in the “Technical debt end date” field.
The “Issue identifiers” field can be used to enter the identifier of one or more issues in an issue tracker system. This can be used to track progress on resolving technical debt. See the Issue tracker section below on how to configure the issue tracker.
The “Create new issue” button can be used to create a new issue in the configured issue tracker. Quality-time will use the issue tracker’s API to create a new issue and will add the new issue’s id to the tracked issue identifiers. The created issue is opened in a new browser tab for further editing. You may have to allow Quality-time to open popup windows in your browser.
Note
Metrics with accepted technical debt are displayed with a money icon and grey background as long as their measurement value is worse than their target and equal to or better than their technical debt target.
However, measurement values of a metric with accepted technical debt will not be evaluated against the technical debt target when:
the metric has a technical debt end date that is in the past, or
the metric has issues associated with it, and the issue tracker reports that all these issues have been resolved.
If any of these situations apply, the technical debt target is ignored and the measurement value is evaluated against the target values. Depending on the evaluation, the metric is shown as green, yellow, or red, as usual.
Also, when the technical debt target is ignored, the target value is shown with a grey background in the target column and has a popup explaining why the accepted technical debt target is being ignored.
The “Comment” field can be used to capture the rationale for accepting technical debt, or any other information. HTML and URLs are supported.
Reordering metrics
To reorder metrics, expand the metric in the metric table and use the buttons on the lower left-hand side to move the metric one row higher or lower, or to the top or bottom of the table. The order is saved on the server. You can temporarily override the default ordering of the metrics by clicking a column headers to sort the metrics by the values in that column.
Deleting metrics
To delete a metric, expand the metric in the metric table and click the “Delete metric” button. The metric and its sources are deleted.
Danger
Be careful, there’s no way to undo your action via the user interface.
Configuring sources
Adding sources
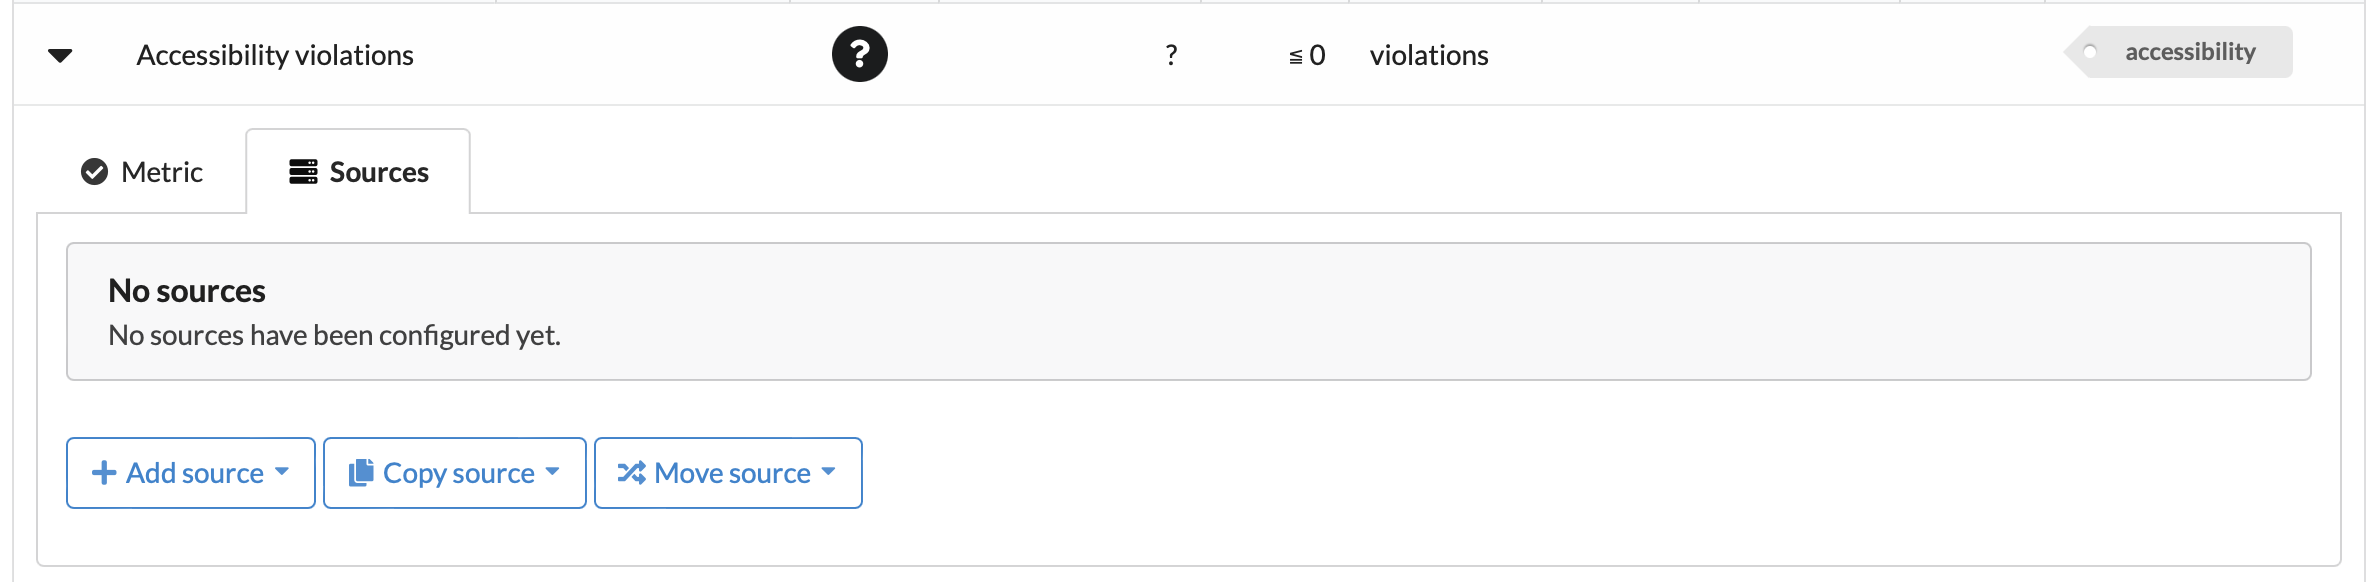
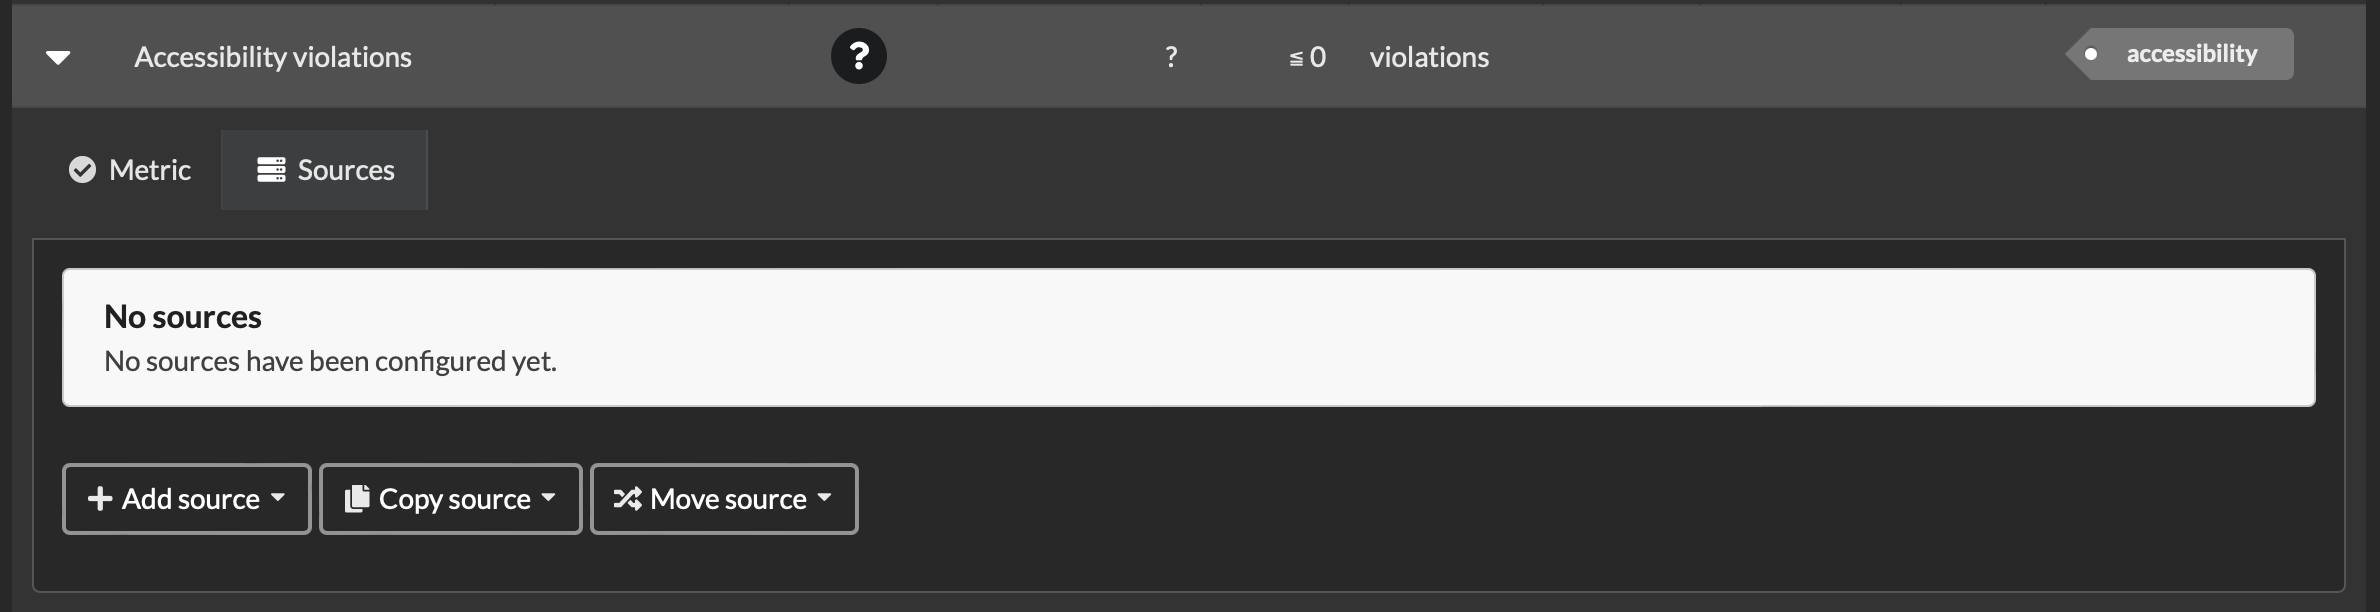
To add a source to a metric, expand the metric in the metric table and then click the “Sources” tab. In the “Sources” tab, click the “Add source” button and select a source type. Only sources that can support the metric type are listed.
See also
See the reference manual for the list of supported source types.
Alternatively, you can also copy an existing source or move an existing source to the metric. Clicking the “Copy source” or “Move source” button shows a drop down menu with all of the sources to choose from.
Note
When copying a source, the changelog is not included. When moving a source, the changelog is preserved.
If you add multiple sources for one metric the measurement values of each source are combined to get one measurement value for the metric. Usually this means adding up the values, but for some metrics this doesn’t make sense and the minimum or maximum value of the sources is used as the metric value.
Editing sources
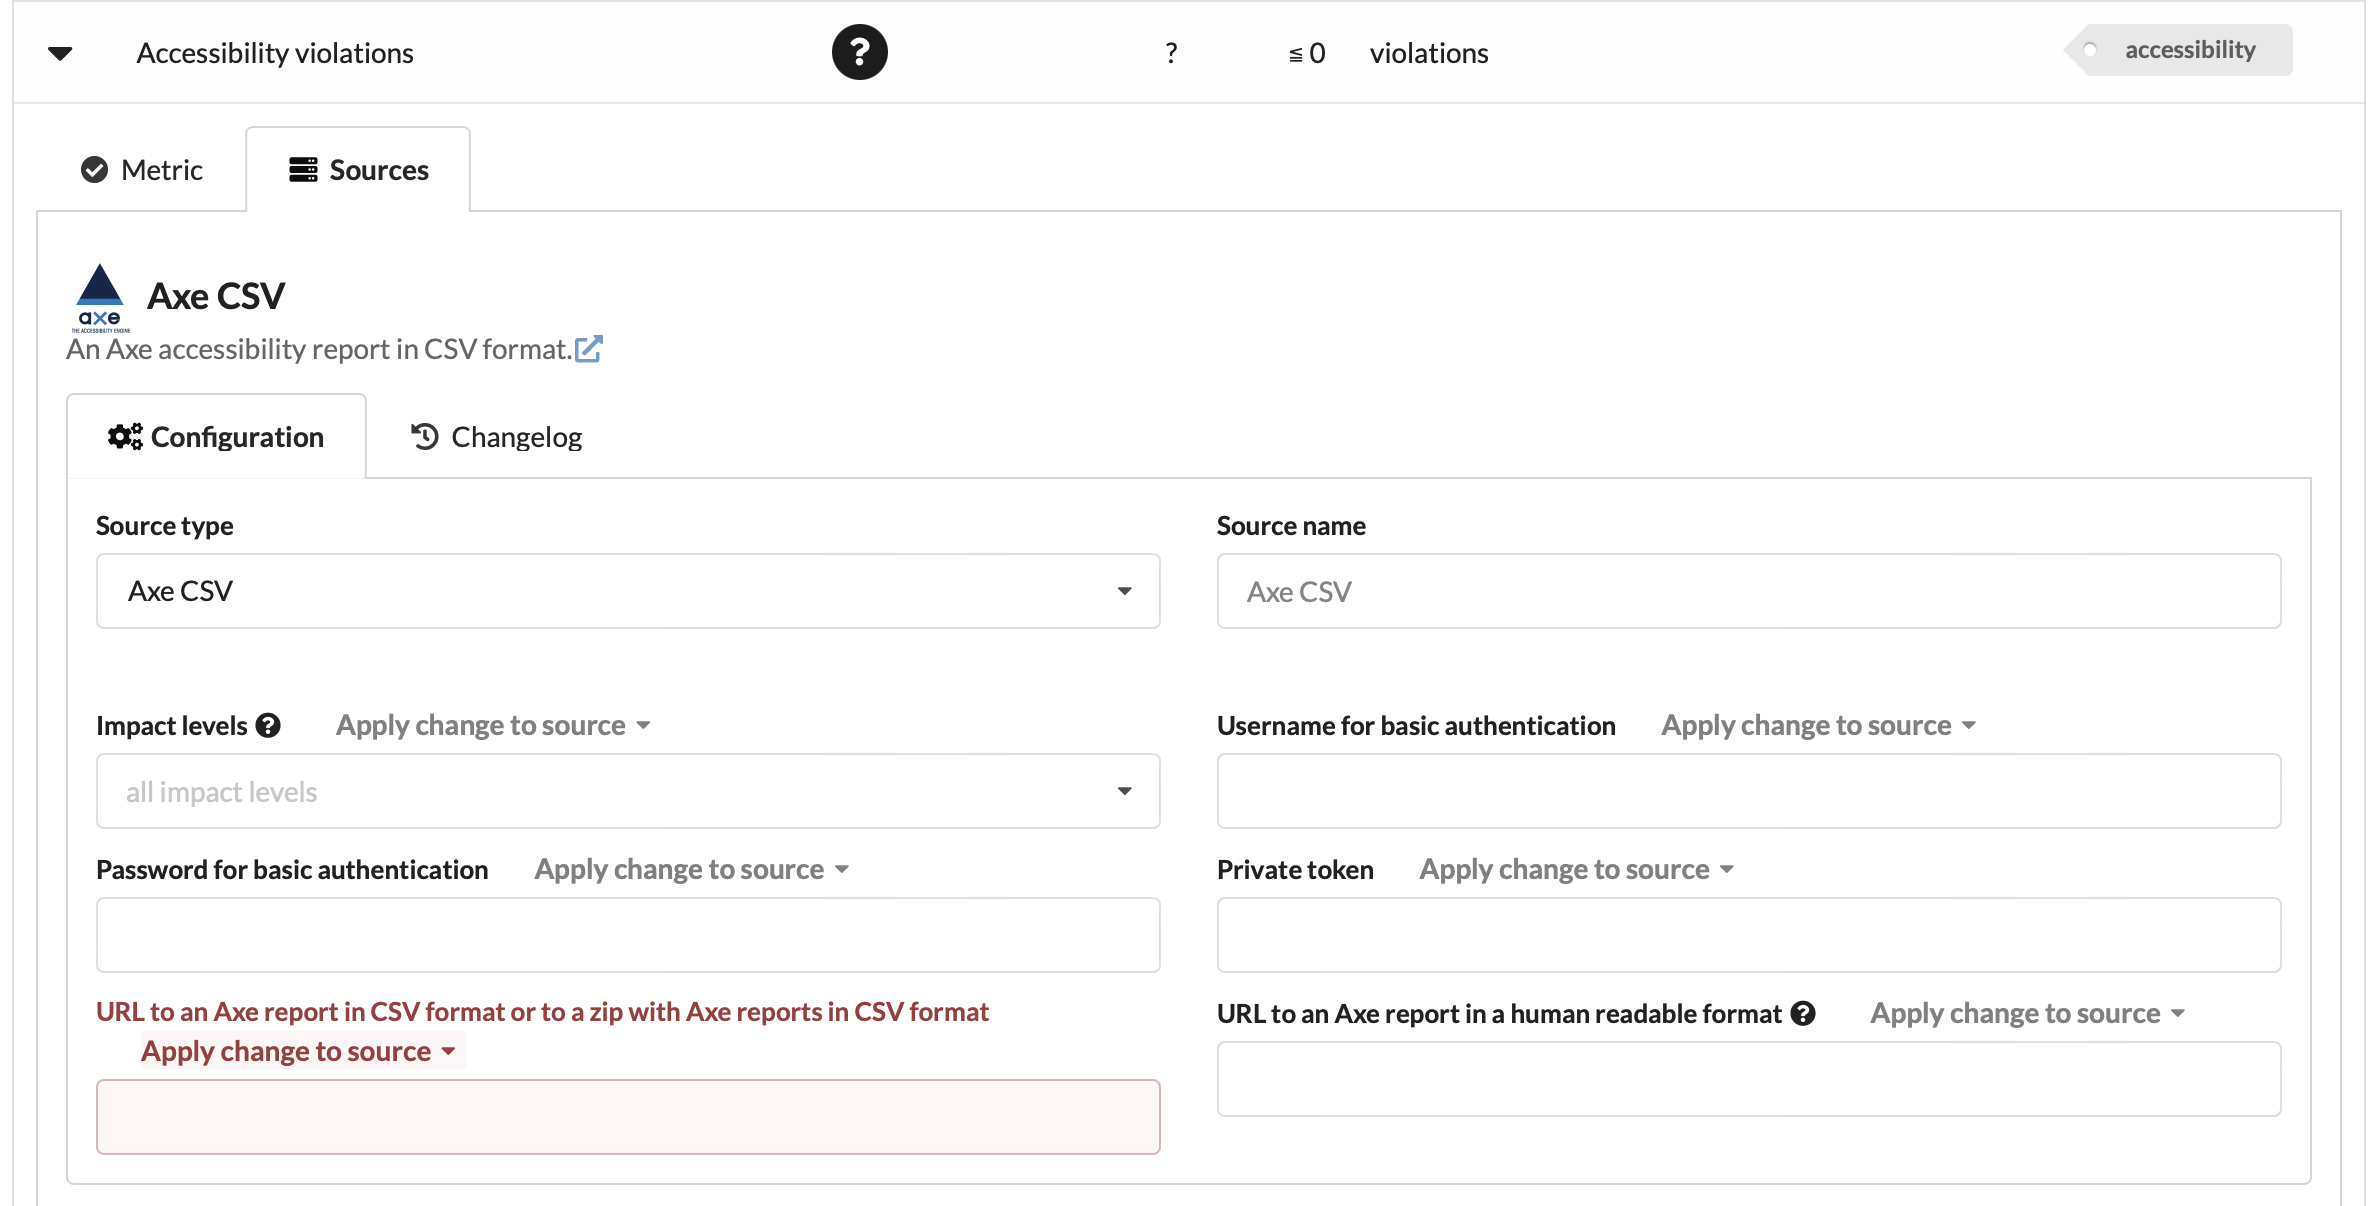
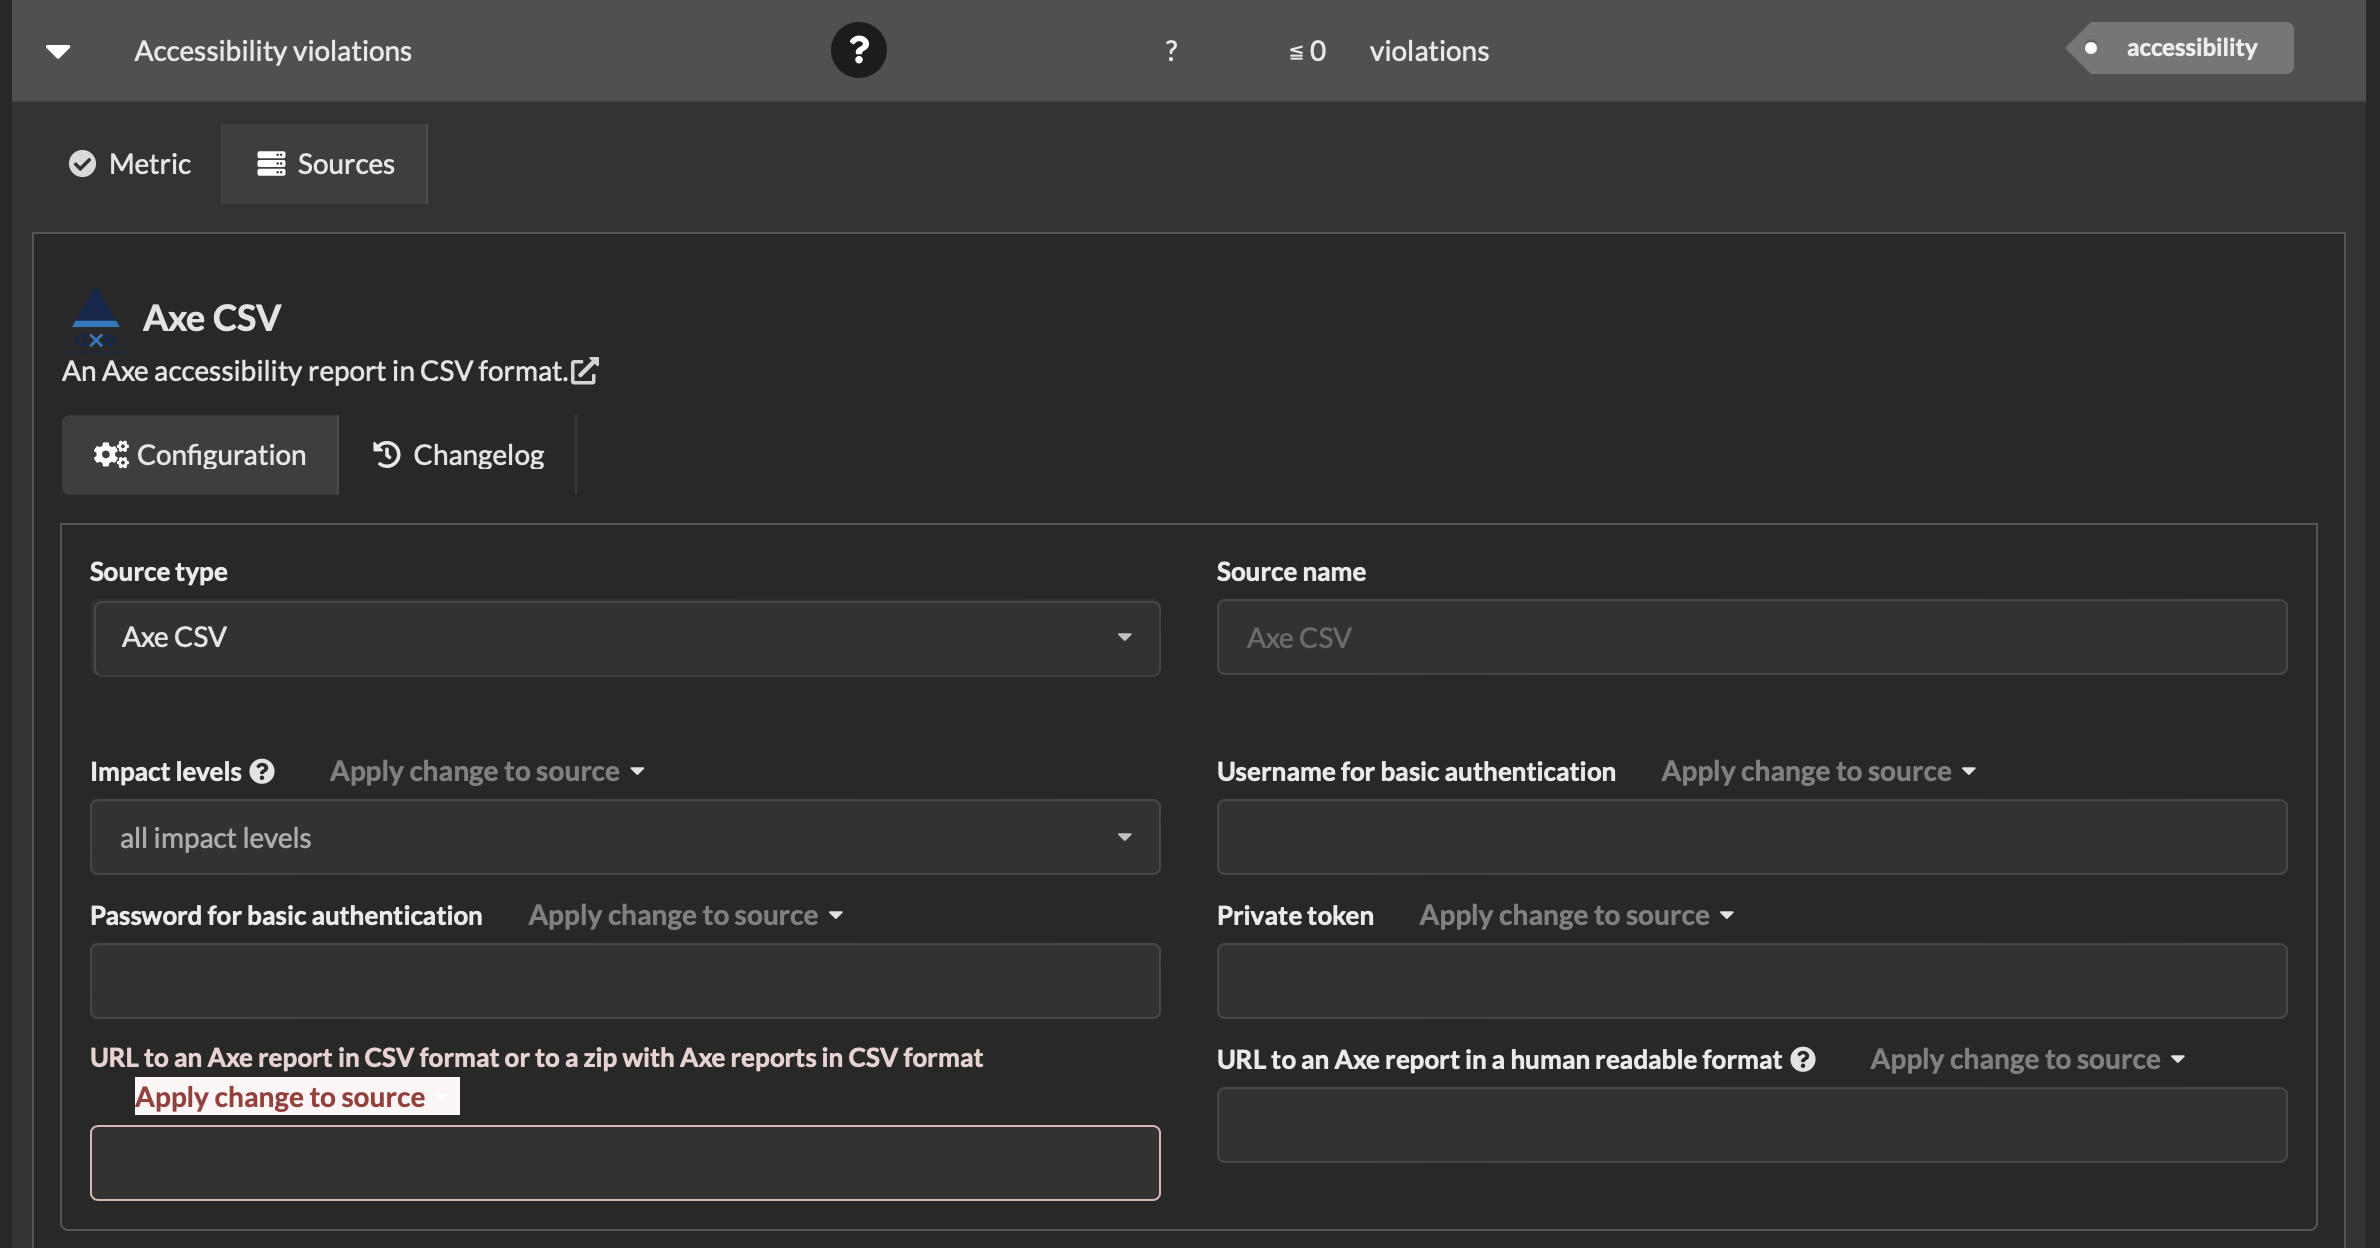
After you’ve added a source, you can change the source type using the “Source type” drop-down menu. The available source types depend on the metric type. E.g. OWASP Dependency-Check supports the security warnings metric type, but GitLab does not so GitLab is not shown.
By default, the name of the source equals the source type but this can be overridden using the “Source name” field.
The parameters that sources need differ per source type. Most sources need a URL, and optionally take either a username and password or a token so that Quality-time can access the source. If a parameter is required, this is indicated with an asterix (*) as shown below.
To change location parameters (URLs, usernames, passwords, etc.) of a source that is used multiple times in a report, expand the report title, and activate the “Sources” tab. Changes made to a source there are applied across the report.
Deleting sources
To delete the source of a metric, first expand the metric in the metric table. Then, select the “Sources” tab and click the “Delete source” button. The source is deleted and no longer used to measure the metric.
Danger
Be careful, there’s no way to undo your action via the user interface.
Reordering sources
To reorder sources, expand the metric in the metric table and click the sources tab. Use the buttons on the lower left-hand side of each source to move the source up or down, or to the top or bottom of the list of sources. The order is saved on the server.
Configuring entities
An entity is a measured entity, such as one single failed job in GitLab for a metric that measures failed GitLab jobs or a single violation in SonarQube for a metric that measures violations. What exactly an entity is, and what properties it has depends on what the metric in question is measuring.
Not every metric will have entities. For example, the source up-to-dateness metric has “days” as unit. These are not shown as measurement entities. But, the issues metric does show the individual issues as measurement entities. To prevent performance issues and limit the storage capacity needed, Quality-time stores and shows at most 250 entities per metric.
To add a source to a metric, expand the metric in the metric table and then click the tab with the source name. It will show a list of entities with all its details.
When clicking on one of the entities, it can be expanded and edited. Options are for example mark an entity as false positive or as fixed. Entities marked as fixed, false positive, or won’t fix are crossed out and subtracted from the measurement value. For example, if a source reports 14 security warnings and two are marked as false positive, the measurement value will be 12.
When setting the status of an entity, the end date of that status is also set. By default, the status end date is set to 180 days after the current date for confirmed, false positive, and won’t fix. The status end date for fixed is 7 days as ‘fixed’ means the entity should disappear shortly. These defaults can be customized, see the Desired reaction times section below.
Customizing quality reports
You can customize quality reports by changing the dashboard layout, by changing the desired metric reaction times, by filtering metrics, and by filtering metric entities.
Note
Settings that you change via the ‘Settings’ panel are not shared with other users.
Customizing dashboards
Both the reports dashboard on the Quality-time landing page and the dashboard of individual projects can be customized by dragging and dropping the cards.
The dashboard layout is persisted in the database and thus shared with other users.
Desired reaction times
The default desired response times for metrics and measurement entities (violations, issues, security warnings, etc.) can be changed via the report’s title. Expand the report title and navigate to the ‘Desired reaction times’ tab.
Desired metric response times
Each of the metric states that require action - target not met (red), near target (yellow), accepted technical debt (grey), and status unknown (white) - has a desired reaction time in days that can be changed.
For each metric that requires action, Quality-time shows the time left to respond in the time left column. When the deadline is missed, the time left column shows ‘0 days’ with a red background. Hovering over the time left value shows the deadline.
When showing multiple dates in the metric table (this can be done via the Settings panel), Quality-time shows an ‘overrun’ column with the number of days that the metric deadline was missed in the displayed period. The purpose of this information is to gain an understanding of how well the team is responding to metrics that require action.
Desired time after which to review measurement entities
Measurement entities (violations, issues, security warnings, etc.) can have one of five possible status: unconfirmed, confirmed, fixed, false positive, and won’t fix. When setting the state of a measurement entity to a state other than unconfirmed, the end date of the status is also set. The reason is to encourage the status of measurement entities to be periodically reviewed. The default values can be changed.
Measurement trend
By default, subjects show the current measurement value of each metric, together with other details such as the target value, comments and tags. Subjects can also list multiple recent measurement values of each metric to show the measurement trend. Use the ‘Settings’ panel in the menu bar to increase the number of dates displayed. The ‘Settings’ panel can also be used to configure the number of days or weeks between dates.
Sorting metrics
Metrics can be sorted by clicking on the table column headers. The sort order cycles between the default order, sorted ascending by the column click, and sorted descending by the column clicked. The sort order can also be changed via the ‘Settings’ panel in the menu bar.
Filtering metrics by tag
In a report’s dashboard, click on a tag card to show only metrics that have the selected tag. Click the selected tag again to turn off the filtering. To filter on multiple tags, use the ‘Settings’ panel.
Filtering metrics by status
The ‘Settings’ panel in the menu bar can be used to hide metrics that need no action.
Hiding columns
The ‘Settings’ panel in the menu bar can be used to hide specific columns from the metric tables.
Export reports as PDF
Quality-time reports can be downloaded as PDF. To create PDFs, Quality-time has a rendering service included to convert the HTML report into PDF.
As Quality-time has to open the report in a (headless) browser and load all the metrics, creating the PDF can take some time. Especially for big reports.
Tip
The report title in the footer of the PDF will link to the online version of the same report.
To manually download a PDF version of a report, navigate to the report and click the “Download report as PDF” button in the menu bar to create and download the PDF report.
The exported PDF report has the same metric table rows and columns hidden as in the user interface, and has the same metrics expanded as in the user interface. The exported PDF report also has the same date as the report visible in the user interface. Dates in the exported PDF are formatted according to the locale of the user’s browser (but only English and Dutch are currently supported, see https://github.com/ICTU/quality-time/issues/10710.
Tip
It is also possible to download a PDF version of the reports overview. Navigate to the reports overview and click the “Download as PDF” button in the menu bar to create and download the PDF report.
See also
See the API-documentation for exporting reports via the API.
Export and import reports as JSON
Quality-time provides functionality for importing and exporting reports in JSON format. This functionality can be used to import template reports, to back up reports, or for transferring reports from one Quality-time instance to another one.
To export a report, use the “Export as JSON” button in the report header. The exported JSON file contains the report configuration but does not include measurements. Source credentials in the exported report are encrypted using the public key of the exporting Quality-time instance. This means that an exported report including its credentials can only be re-imported into the same instance. To transfer a report including its credentials to a different Quality-time instance, use the API to encrypt the credentials with the public key of the destination instance. It is possible to import a report in a Quality-time instance whose public key was not used to encrypt the credentials, but in that case the credentials will not be imported.
To import a report, use the “Import report” button on the reports overview page to select a report in JSON format and import it.
The export and the import buttons are only available to logged-in users.
Both the import and the export functionality are also available via the API.
Export reports as CSV
Quality-time reports can be downloaded as a CSV (comma-separated values) file, for example to import the report into a spreadsheet.
To export a report as CSV, navigate to the report and click the “Export as CSV” button in the report header.
The exported CSV mirrors the report as currently displayed: it contains the same subjects and metrics, honors the current sort order, hidden tags, and hidden or empty columns, and contains a column for each visible date (the same contract as the PDF export). The trend sparkline column is not included because it has no textual representation.
As the CSV contains no source credentials, the “Export as CSV” button is available to all users, also when not logged in.
Issue tracker
To track work being done on metrics, for example to resolve technical debt, it’s possible to add (identifiers of) issues to metrics. Quality-time uses these issue identifiers to check the status of the issue with an issue tracker. For this to work, an issue tracker needs to be added to the report. Expand the report header and configure the issue tracker in the issue tracker tab. Currently, only Jira can be used as issue tracker. Please consider submitting a pull request if you need support for other issue trackers such as Azure DevOps Server or GitLab.
Multiple issues can be linked to one metric. At most one issue tracker can be configured per report.
DORA metrics
DORA metrics are a set of four key metrics for measuring the performance of software delivery, first described by the DevOps Research & Assessment (DORA) team in the 2016 State of DevOps report. See the DORA research program for more information.
Quality-time can monitor these metrics in the following manner. Add a subject of type Operations process and add the following metrics to the subject:
Deployment Frequency: measure job runs within time period filtered on deployment jobs.
Lead Time for Changes: measure average issue lead time filtered on issues marked as change.
Time to Restore Services: measure average issue lead time filtered on issues marked as failure.
Change Failure Rate: measure change failure rate.
Notifications
Quality-time can send notifications about metrics that change status to Microsoft Teams channels. To enable notifications for a report, expand the report header and paste a Microsoft Teams webhook.
If a webhook has been configured, Quality-time will check for changes in the status of metrics every minute. As soon as one or more metrics in the report change status, a notification will be sent to the Microsoft Teams channel configured by the webhook.